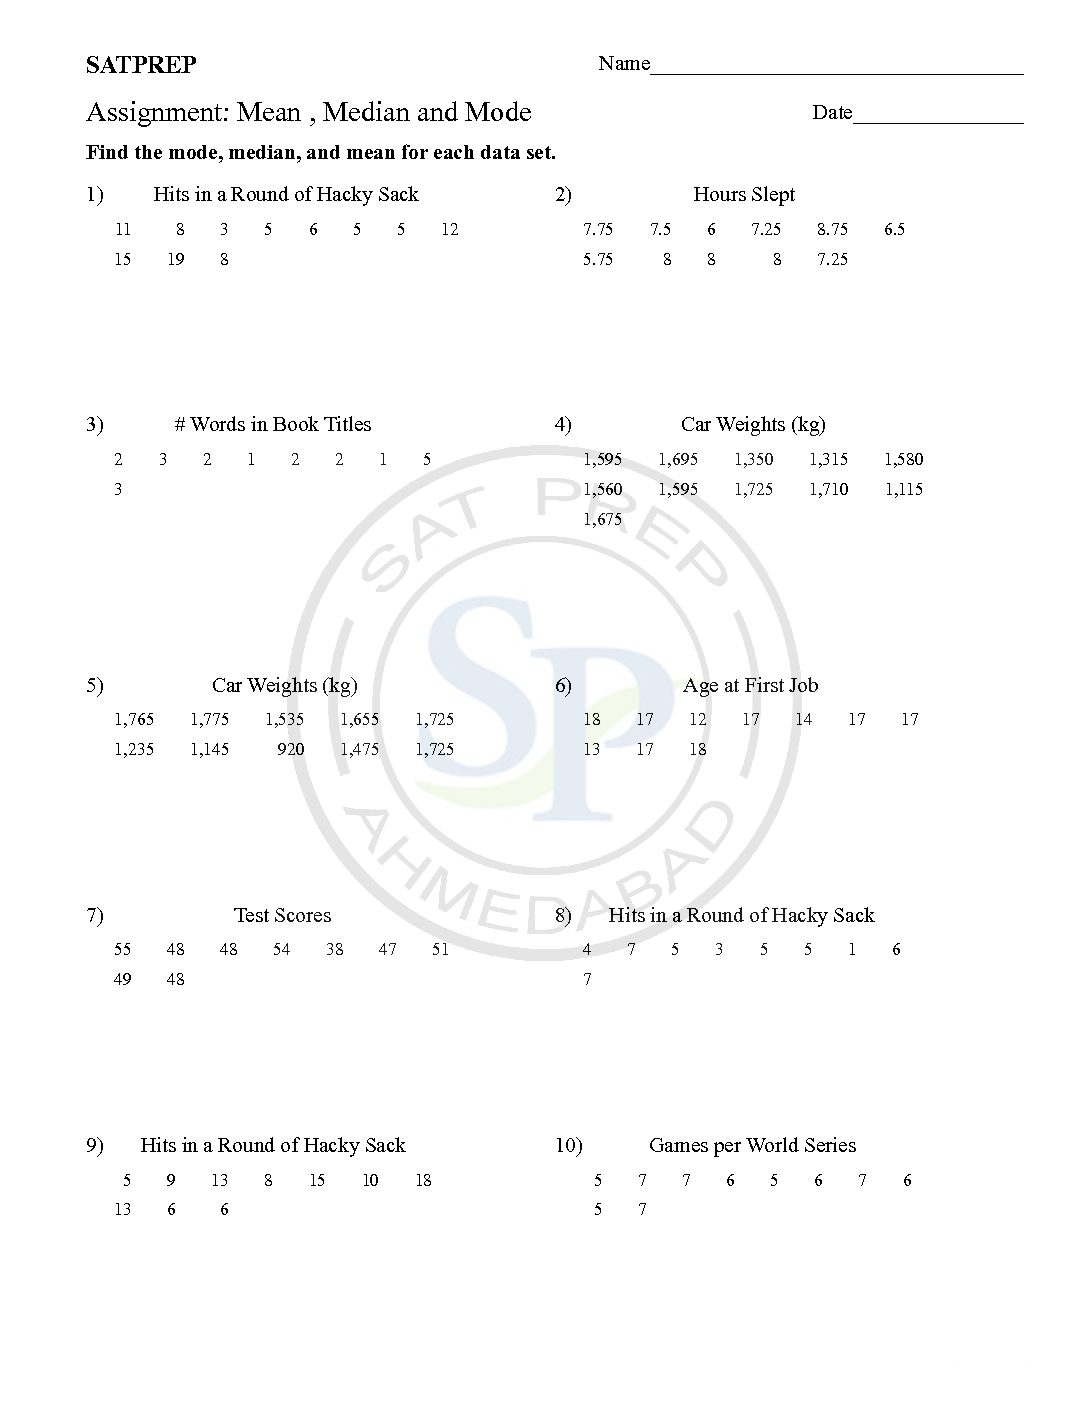
This post is about mean median and mode of data. mean median and mode
You are browsing archives for
Category: Statistics
Binomial Distribution

The Binomial distributions Number of successes in a specified number of independent trials of an experiment . Symbol: B (n, p), where n is the number of trials and p the probability of success in each. As there are two parameter therefore it is Binomial distribution. Hence it used for discrete values. binomial distribution
Normal Distribution
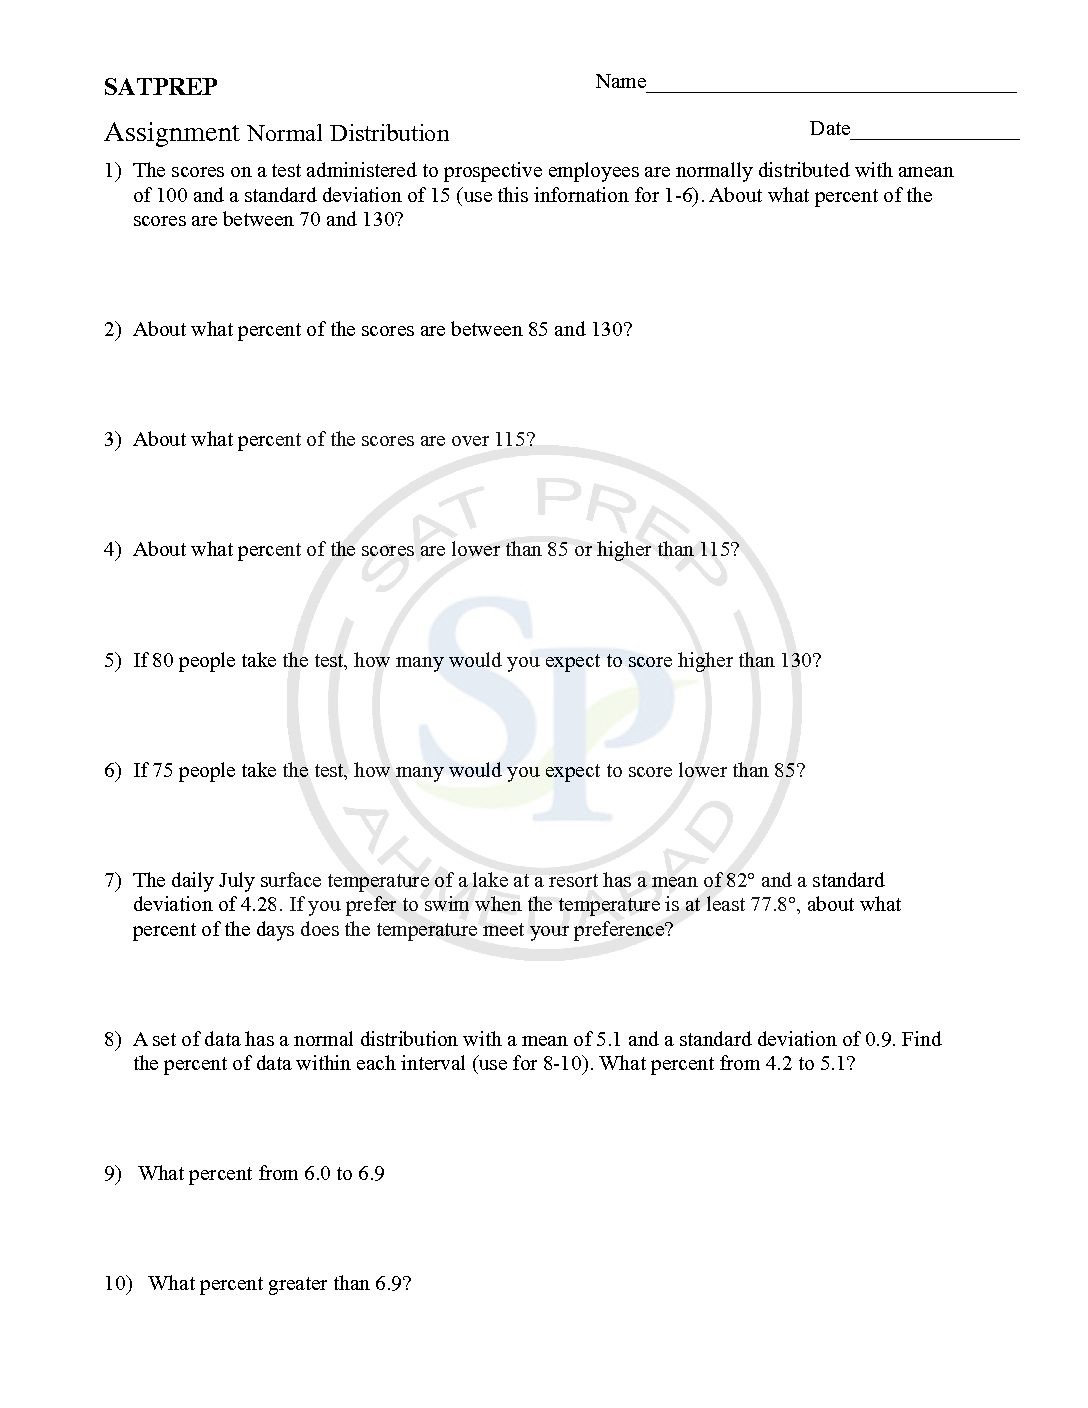
A standard Normal Distribution graph is “Bell Curve”.The standard normal distribution has two parameters: mean and standard deviation. Hence it use for continuous random variable as well as it use for continuous values. Due to continuous values we use area under the curve for calculating probability. Normal
Further Probability
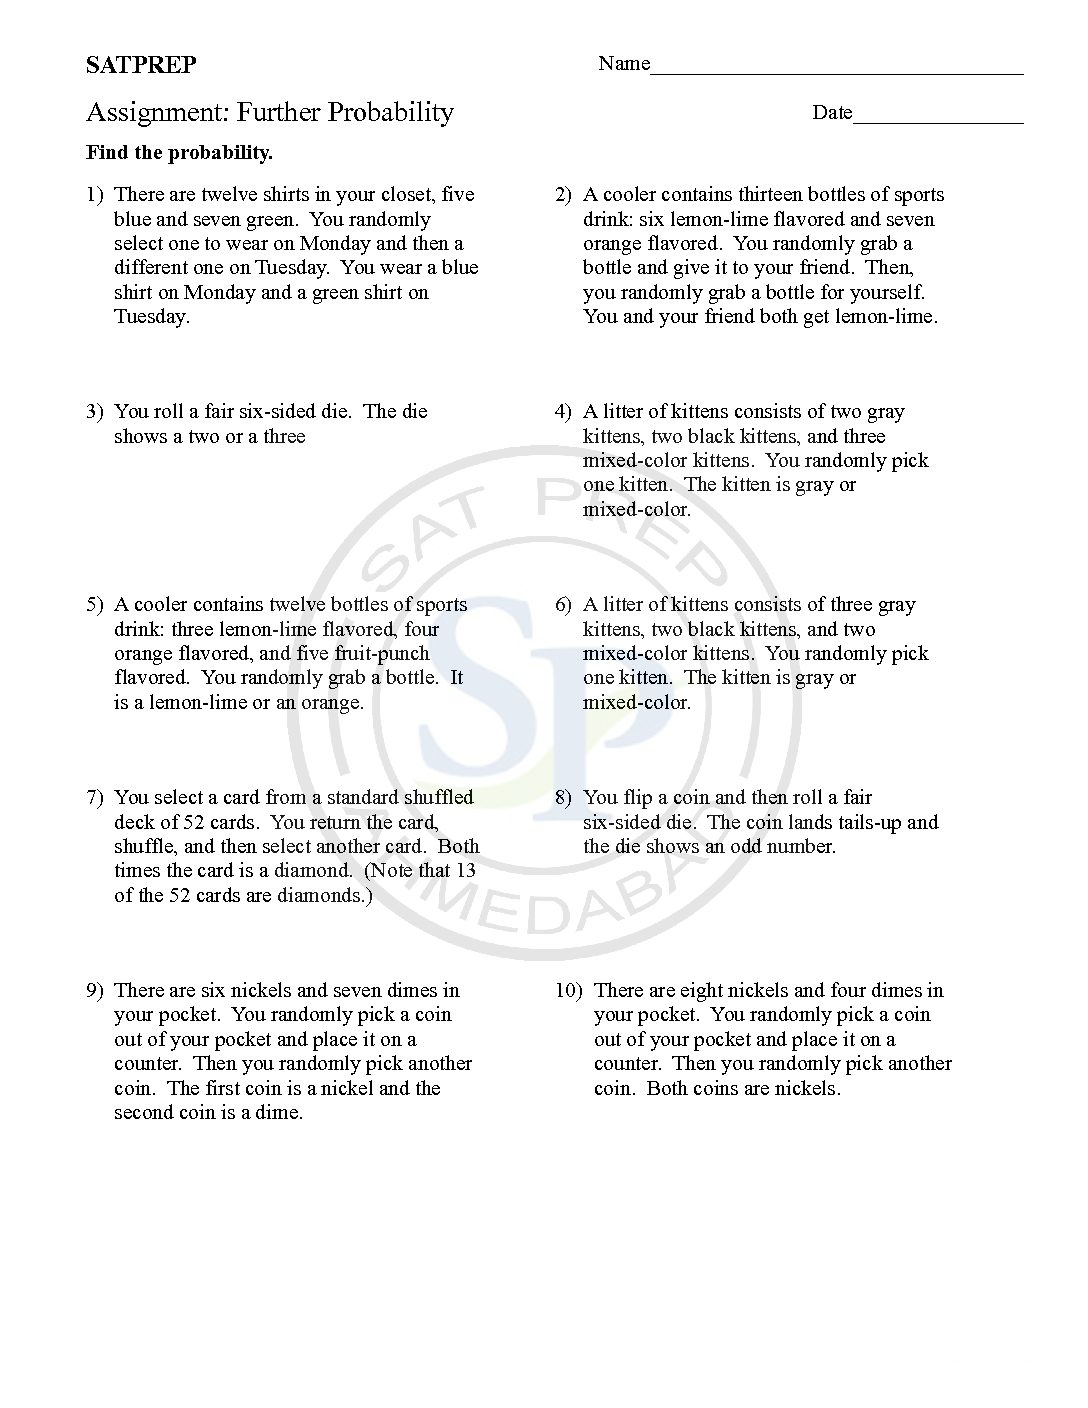
to calculate Further Probability. Further Probability. An event ( E) is a subset of the sample space. That is, an event is a subset of all possible outcomes. We refer to this subset of outcomes as favourable outcomes. further probabilty