This post is about the solution of question of statistics and probability from Math SL Paper -2 past paper. In this post questions are from different paper from Nov 2011 to Nov 2019. By this post students will come to know variety of questions asked in previous year papers. The questions type in this post is […]
You are browsing archives for
Category: Statistics and Probability
Topic wise IBDP Math SL Paper 2 Statisti...
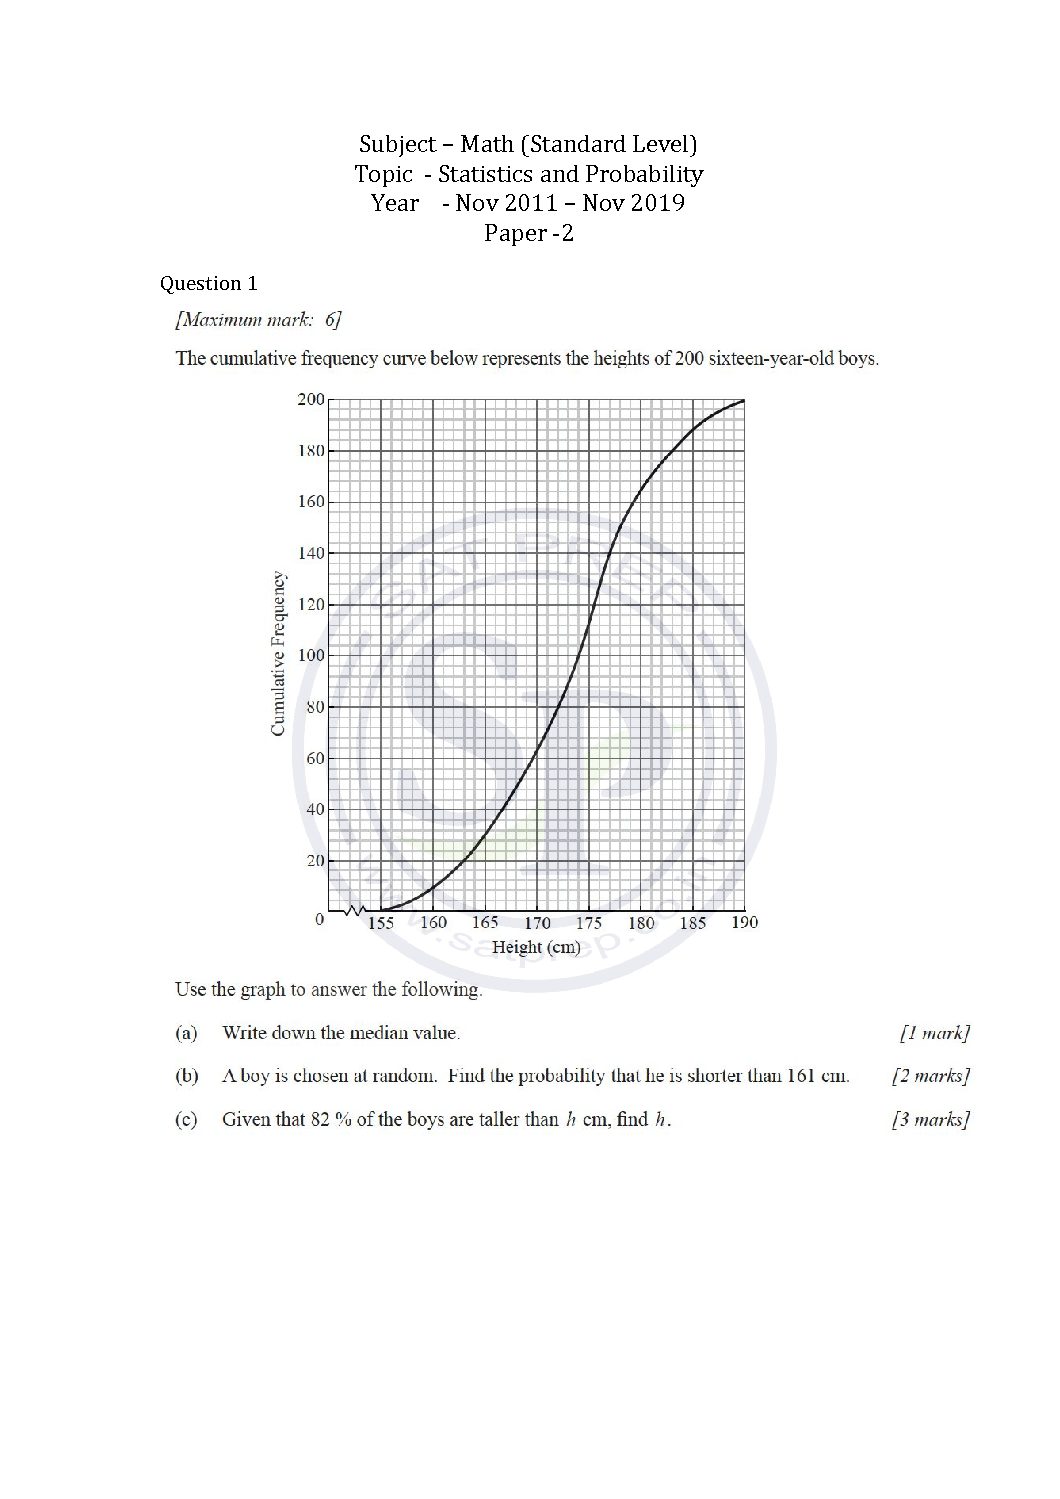
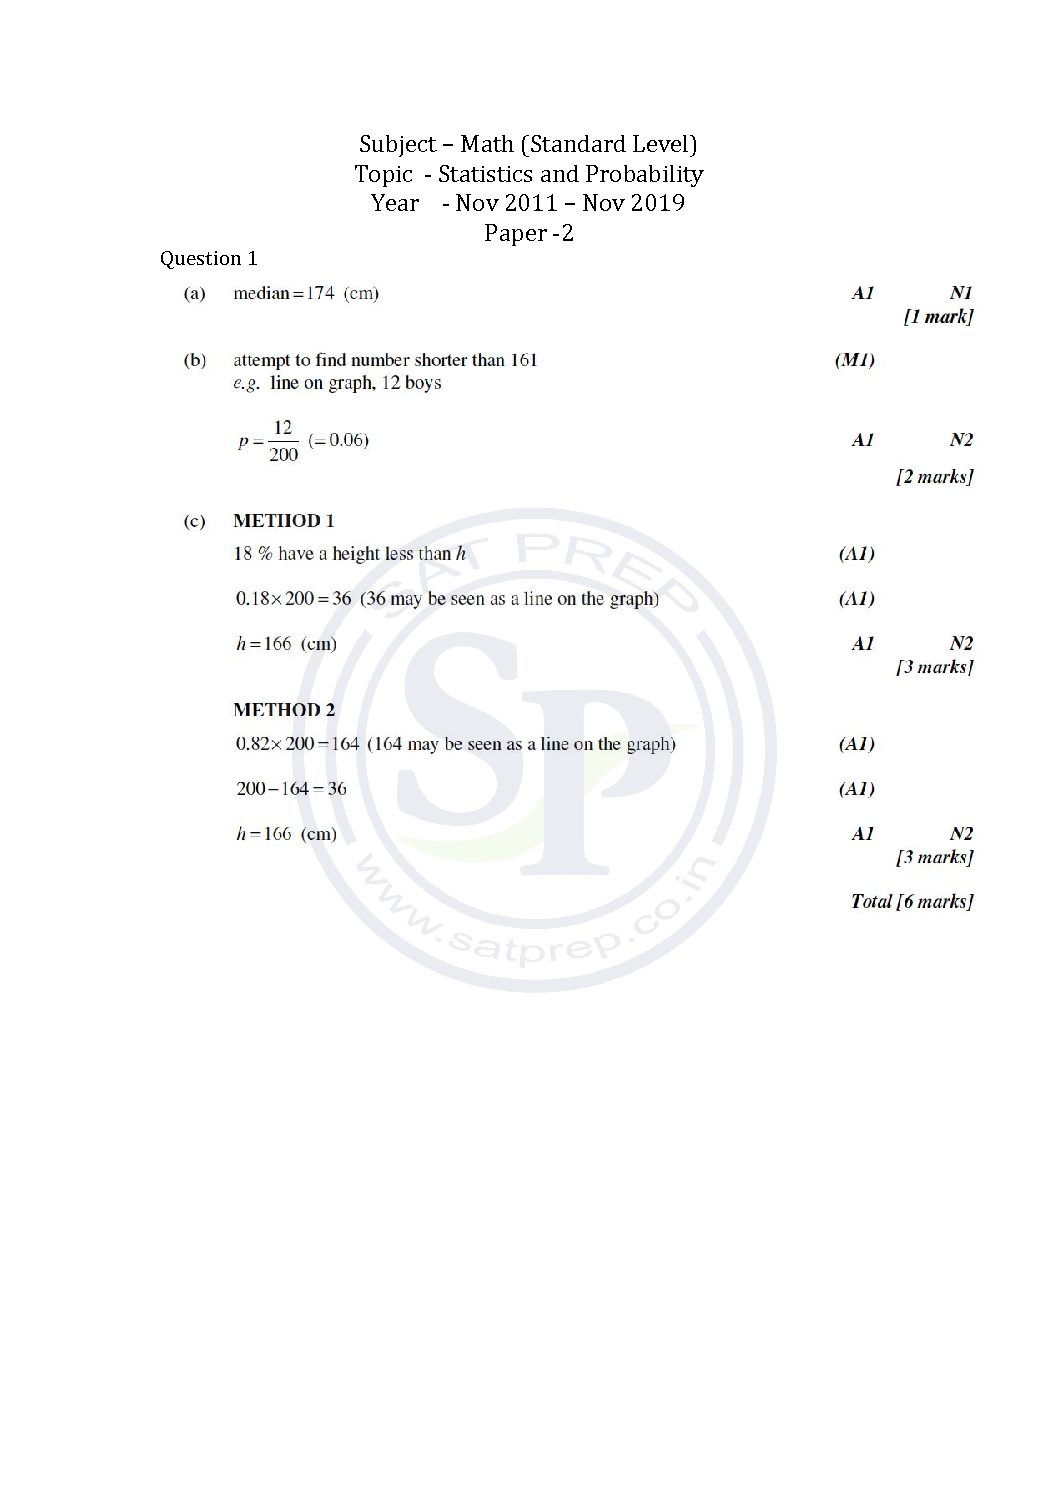
This post is about the questions statistics and probability from Math SL Paper -2 past paper. In this post questions are from different paper from Nov 2011 to Nov 2019. By this post students will come to know variety of questions asked in previous year papers. The questions type in this post is calculator . […]
Topic wise IBDP Math SL Paper 1 Statisti...
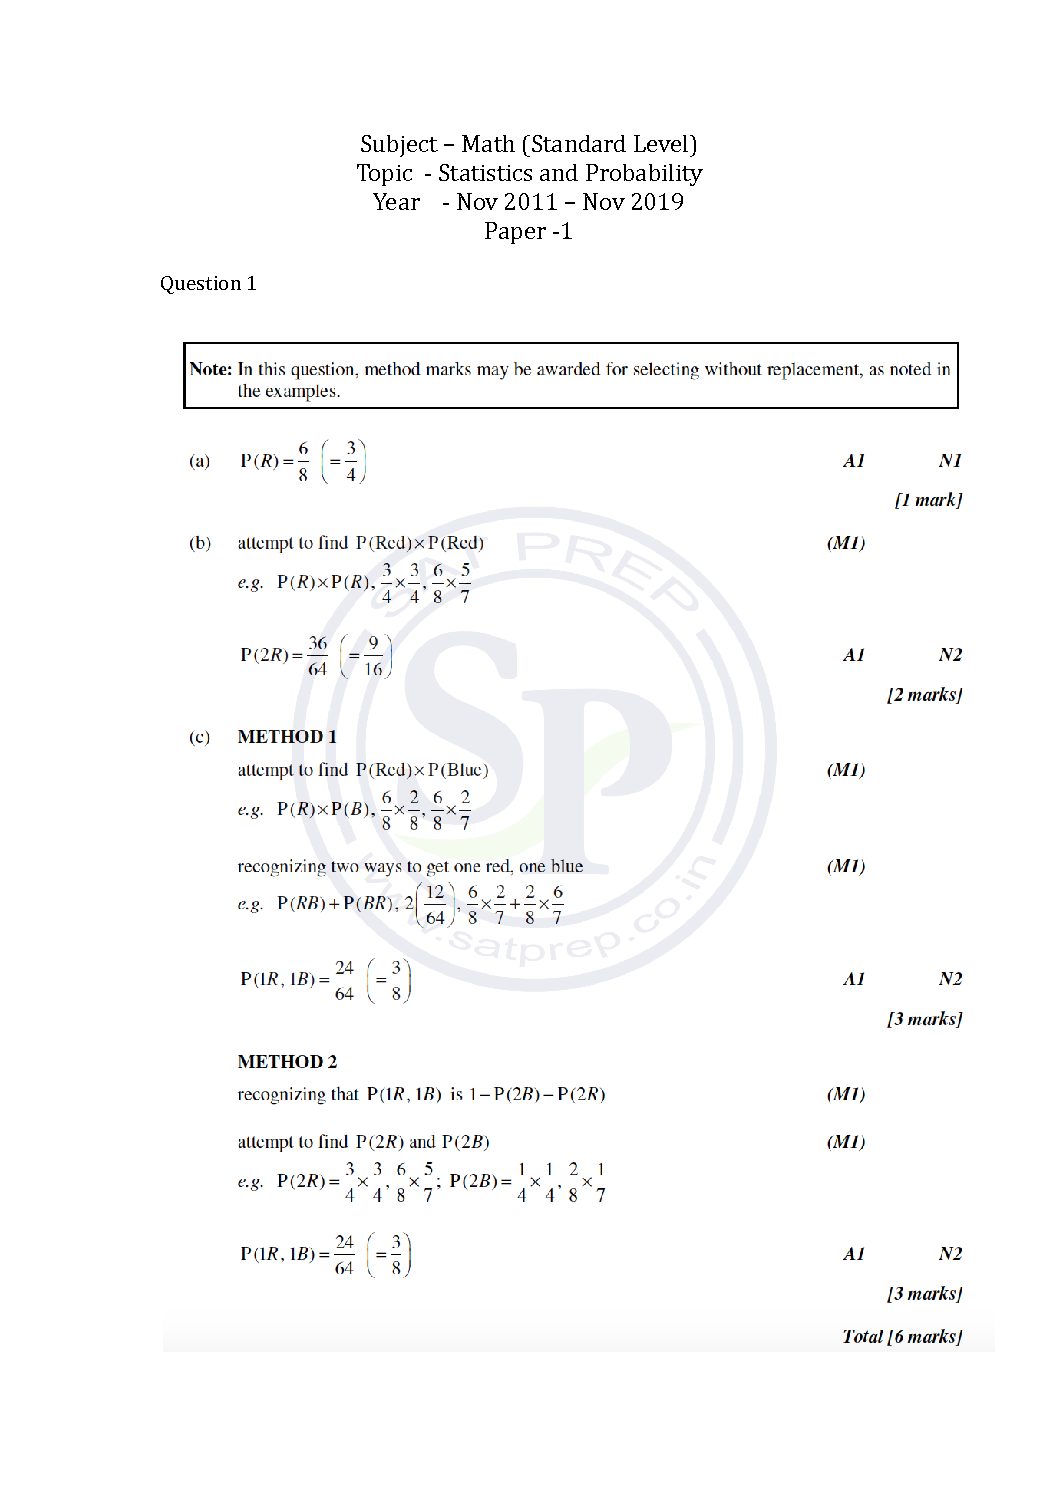
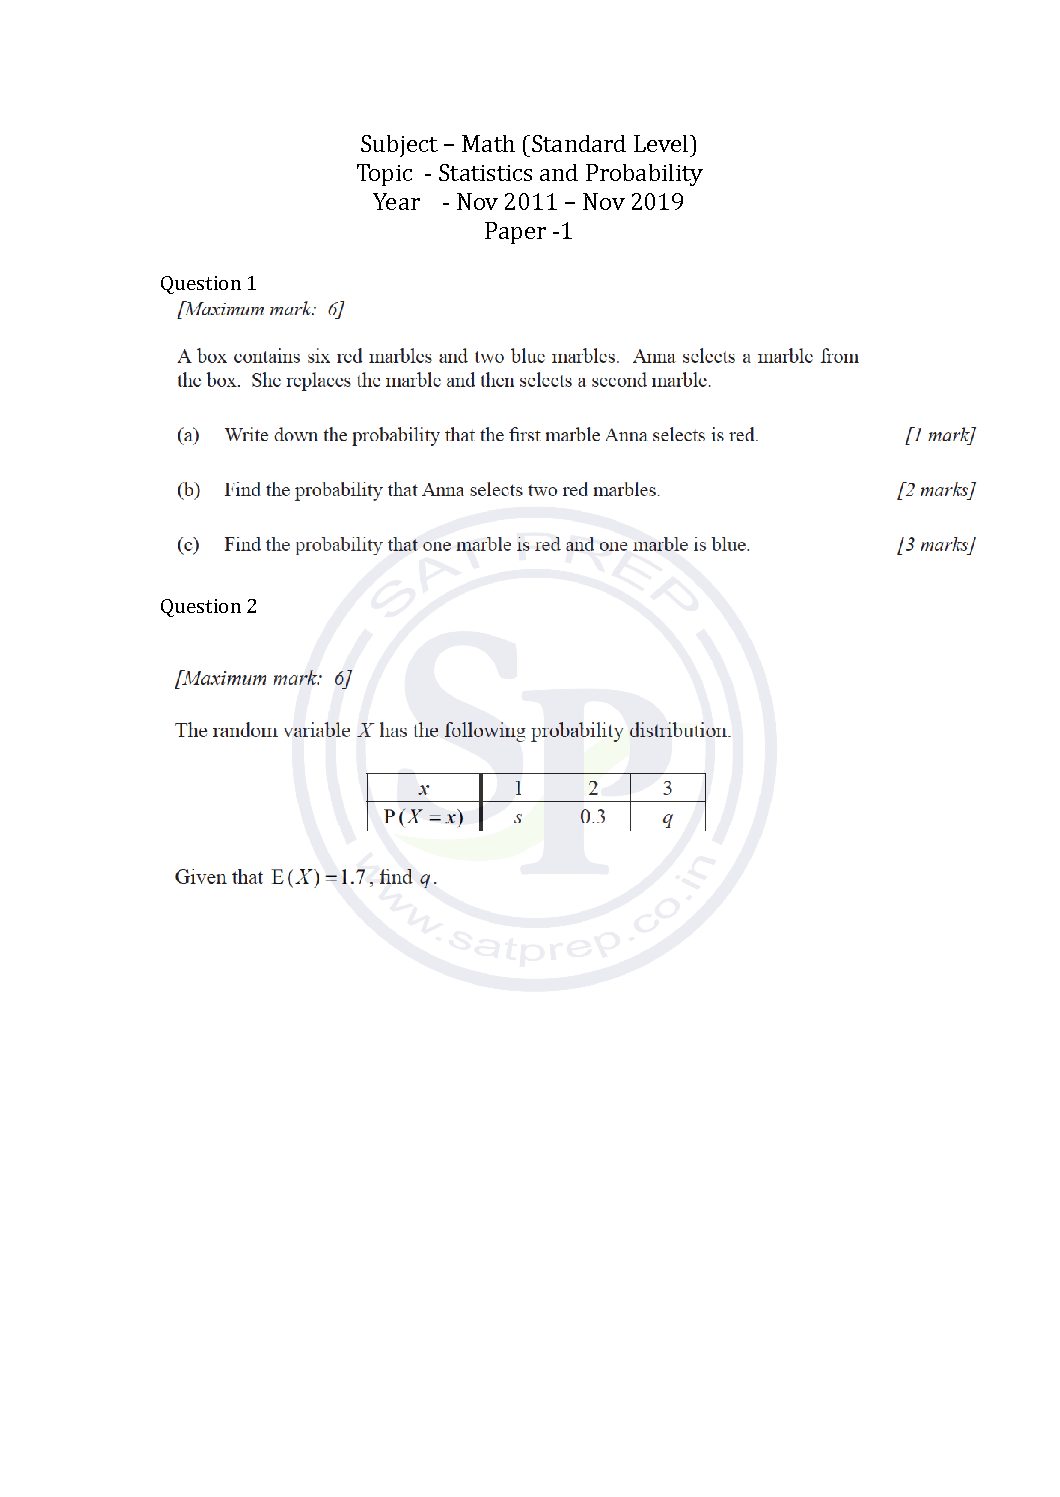
This post is about the solutions of questions of statistics and probability from Math SL Paper -1 past paper. In this post questions are from different paper from Nov 2011 to Nov 2019. By this post students will come to know variety of questions asked in previous year papers. The questions type in this post is […]
Topic wise IBDP Math SL Paper 1 Statisti...
This post is about statistics and probability questions of past papers. In this post questions are from different paper from Nov 2011 to Nov 2019. By this post students will come to know verity of questions asked in previous year papers. The questions type in this post is non calculator . t ib
Binomial distributions
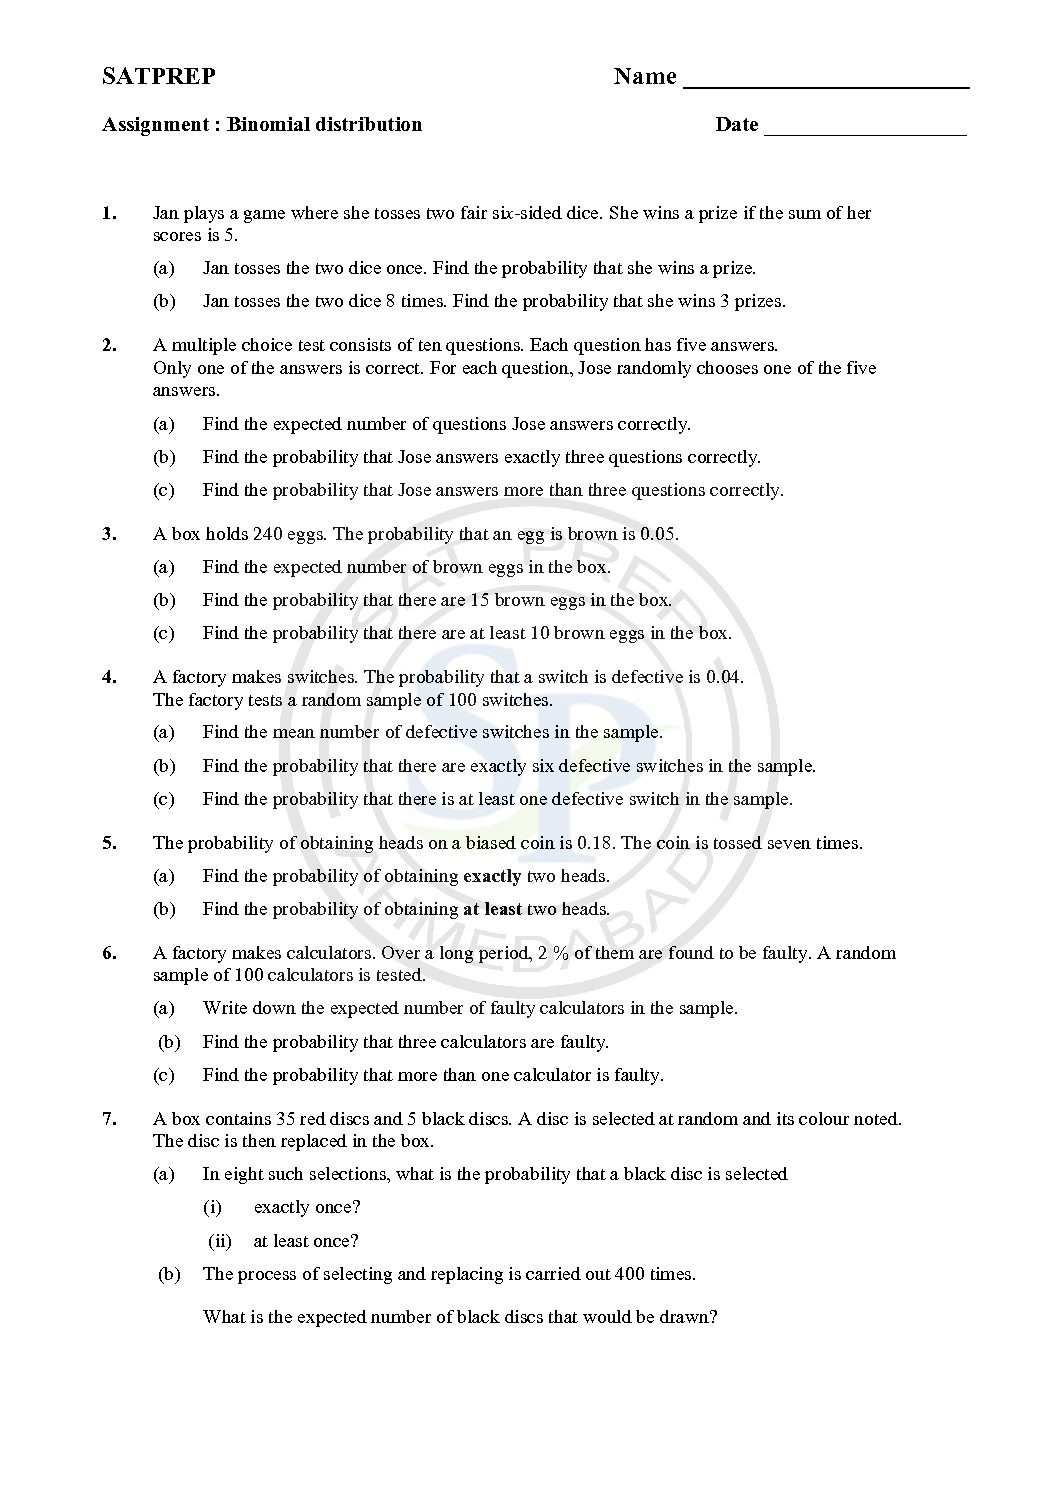
This post is about binomial distributions. The Binomial distribution has two parameters like n and p. Due to n and p it is binomial. these n and p are n and p is the discrete probability distribution of the number of successes in a sequence of n independent experiment. Also we use probability of failure. Binomial
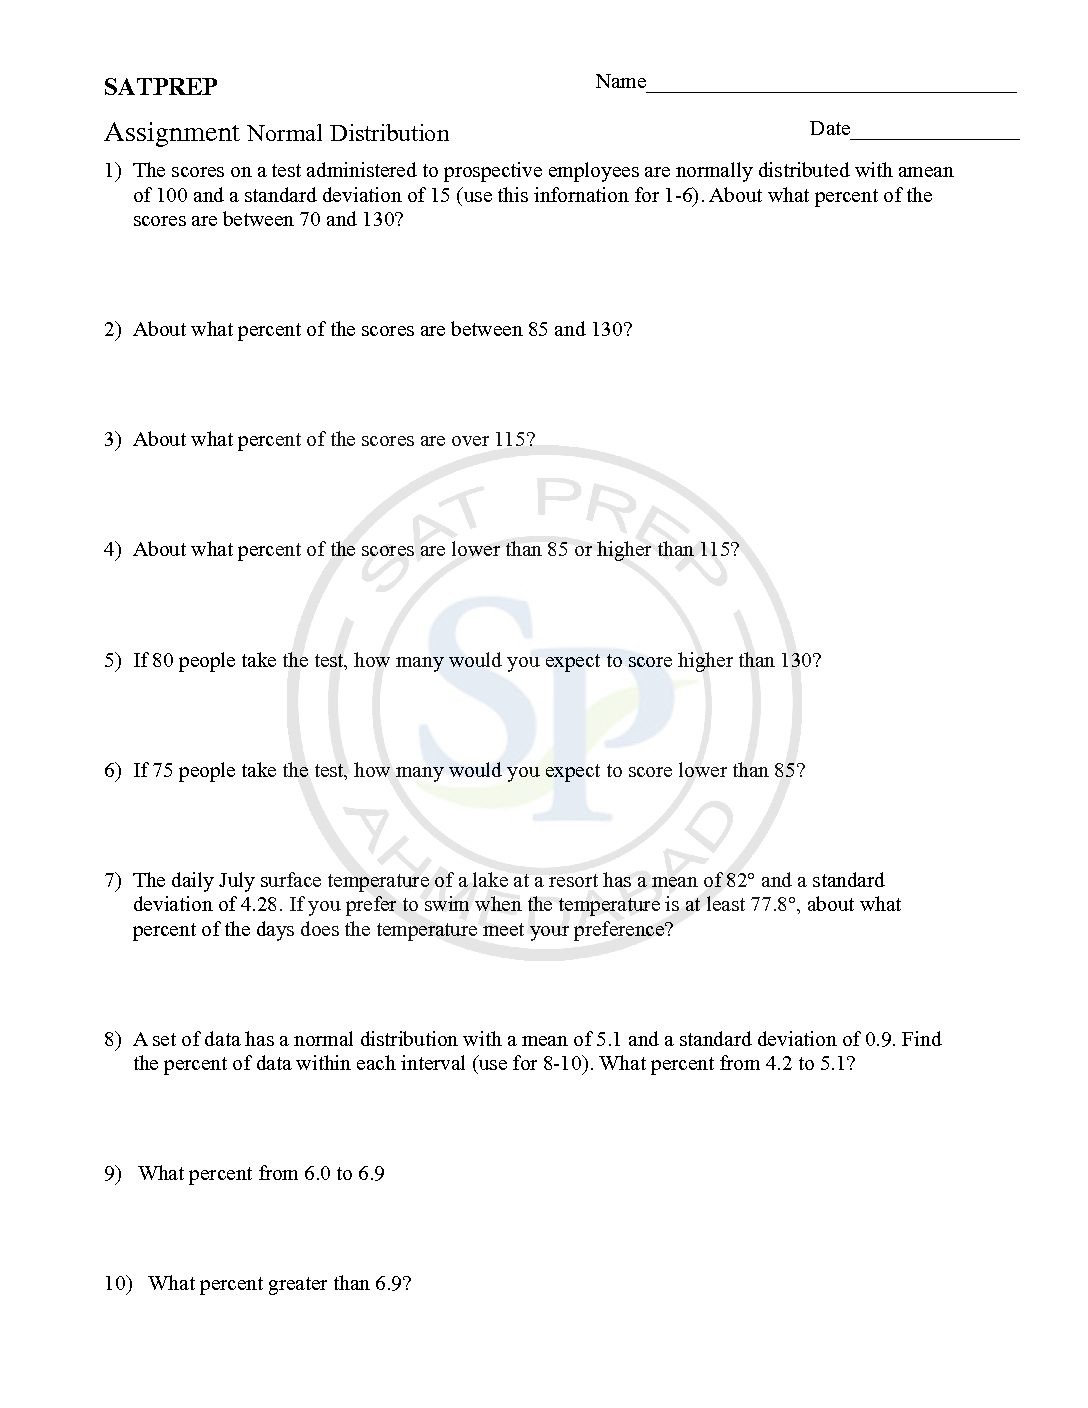
Normal Distribution
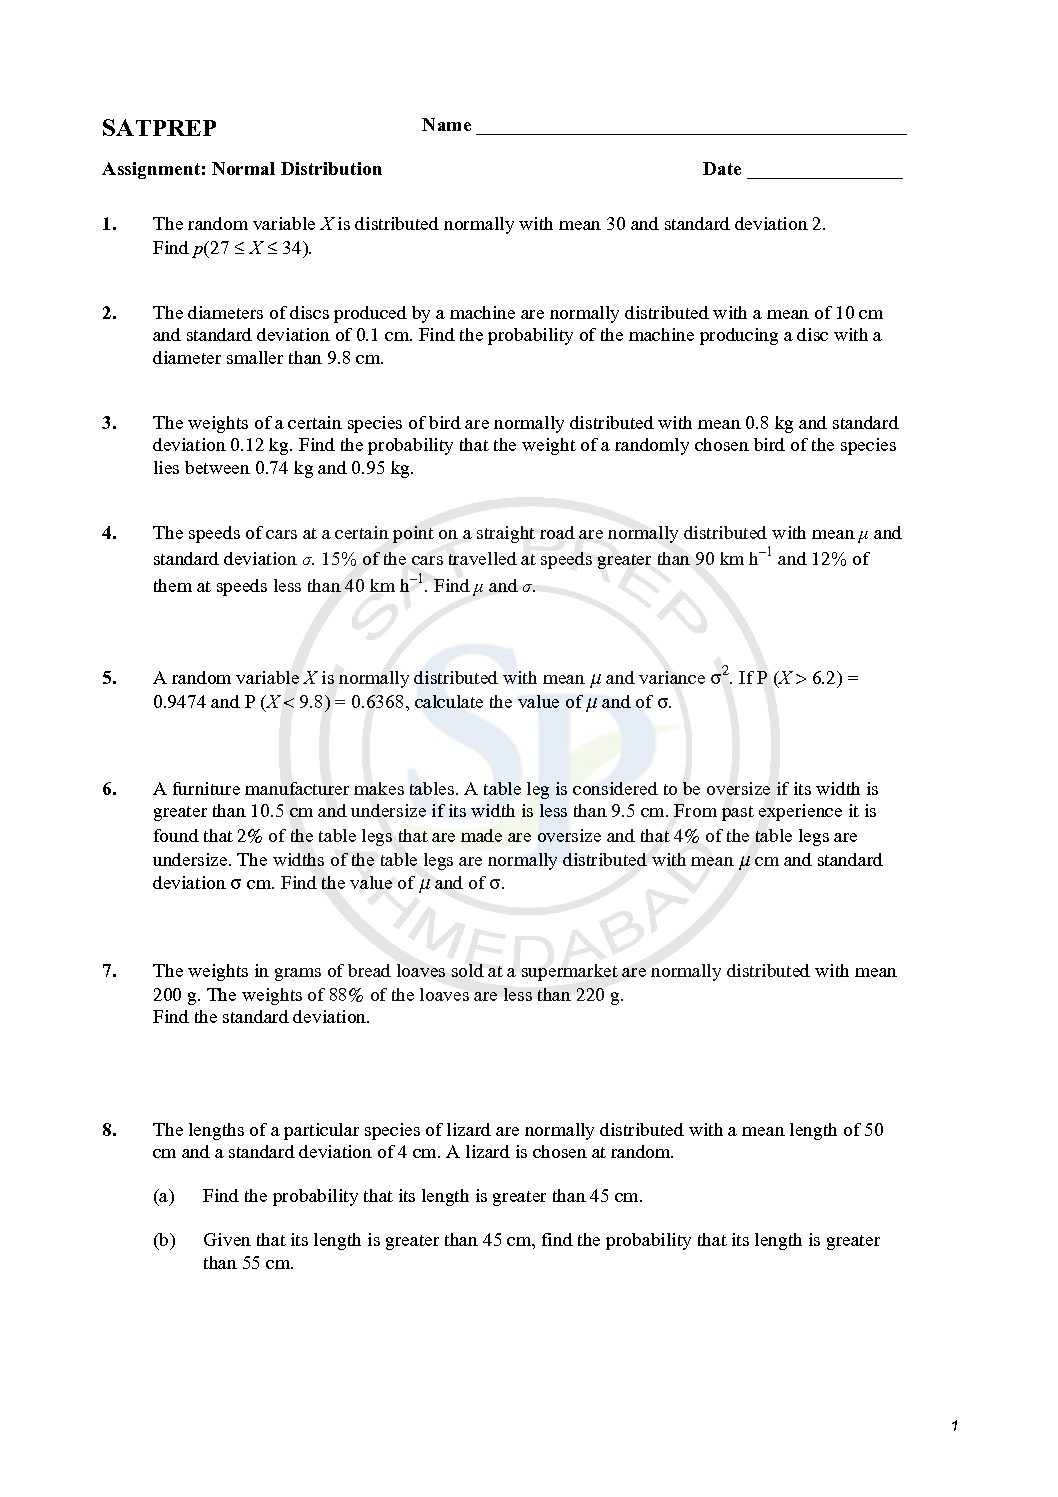
A graphical representation of a normal distributions are sometimes called a bell curve because of its flared shape. The precise shape can vary according to the distribution of the population but the peak is always in the middle and the curve is always symmetrical. In a normal distribution, the mean, mode and median are all the same. The Normal distribution has two […]
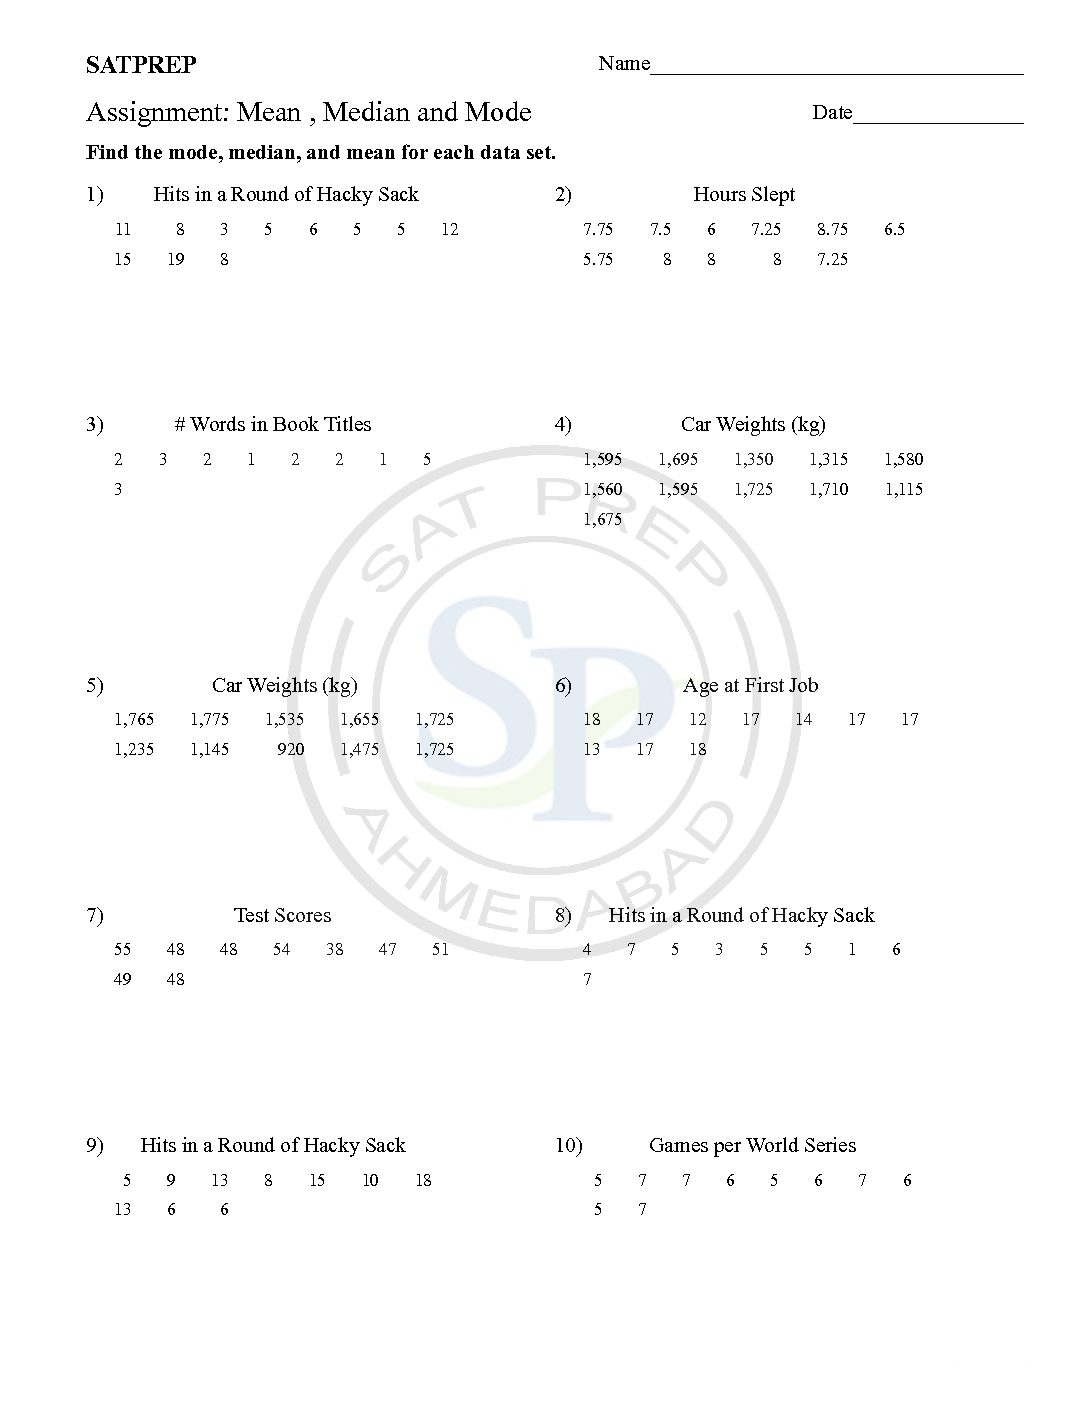
Mean , Median and Mode
Binomial Distribution
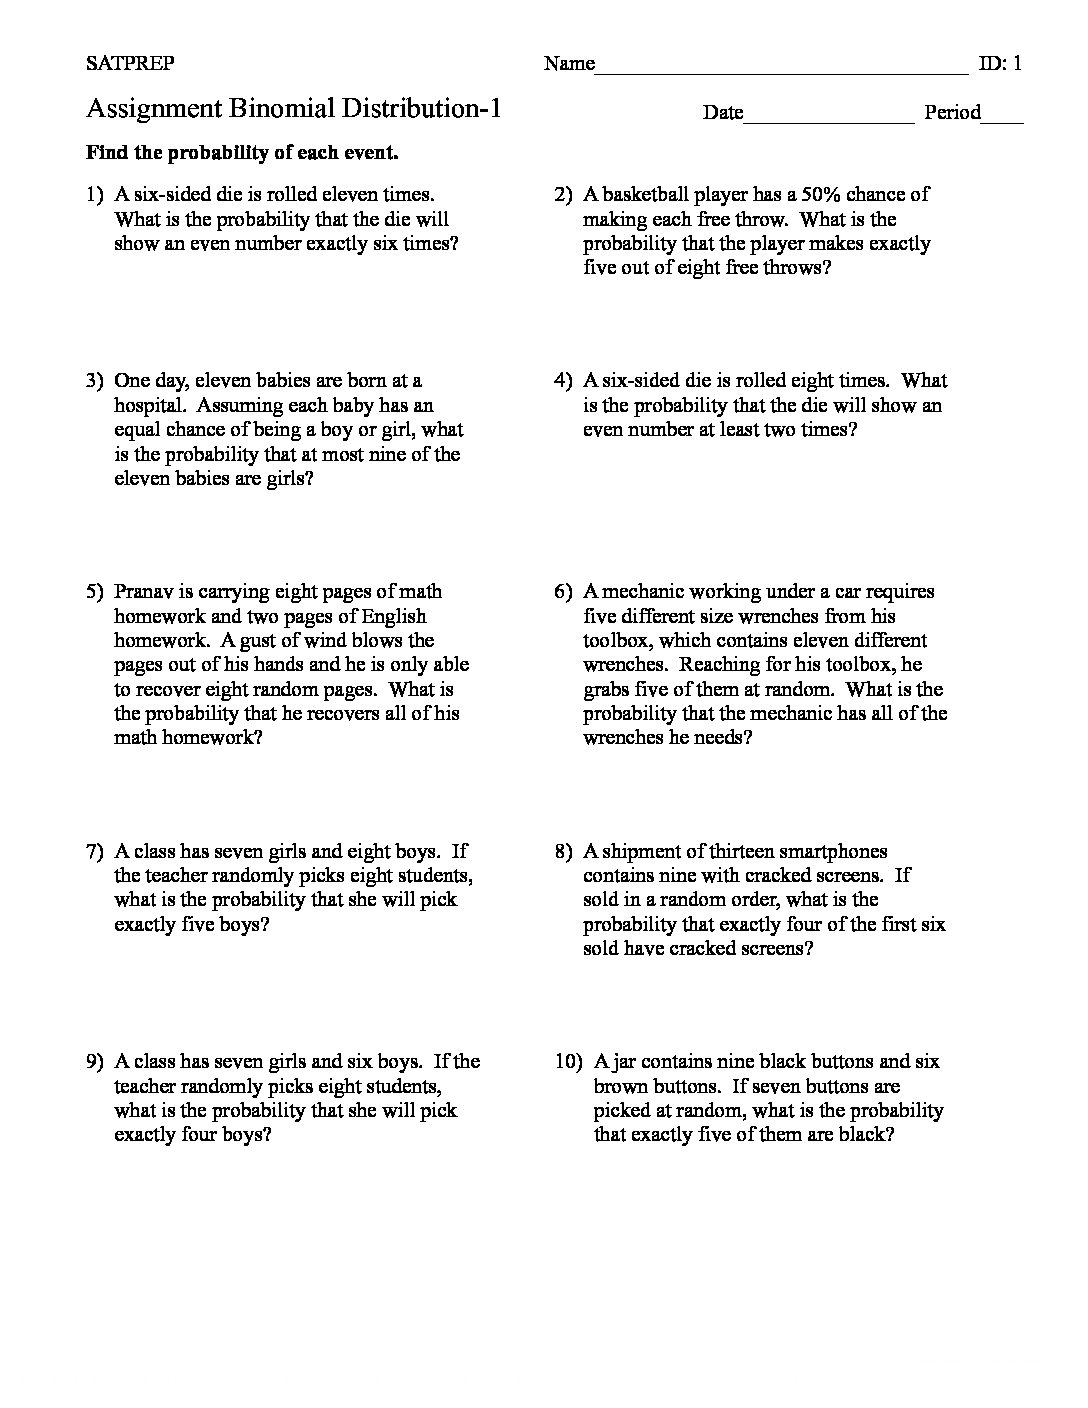
The Binomial distributions Number of successes in a specified number of independent trials of an experiment . Symbol: B (n, p), where n is the number of trials and p the probability of success in each. As there are two parameter therefore it is Binomial distribution. Hence it used for discrete values. Binomial Theorem
Normal Distribution
A standard Normal Distribution graph is “Bell Curve”.The standard normal distribution has two parameters: mean and standard deviation. Hence it use for continuous random variable as well as it use for continuous values. Due to continuous values we use area under the curve for calculating probability. Normal
Further Probability
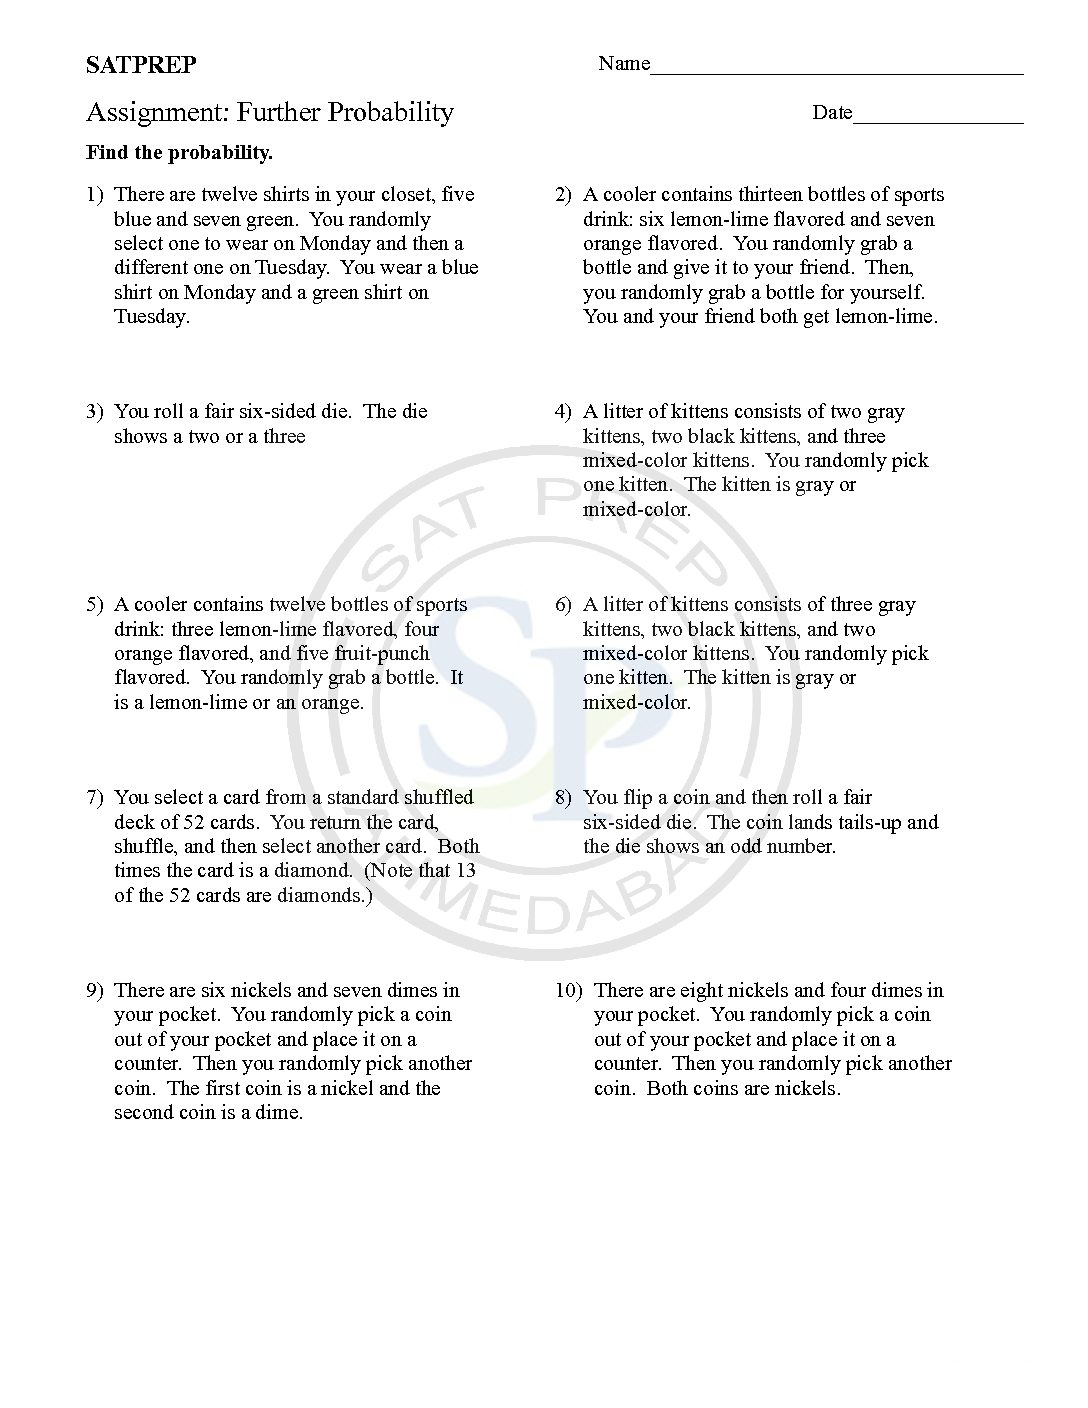
to calculate Further Probability. Further Probability. An event ( E) is a subset of the sample space. That is, an event is a subset of all possible outcomes. We refer to this subset of outcomes as favourable outcomes. further probabilty