
Graphs of Trigonometric Functions. Below are the graphs of the six trigonometric functions: sine, cosine, tangent, cosecant, secant, and cotangent. Explore the amplitude, period, and phase shift by examining the graphs of various trigonometric functions. Graph of y = sin x. Graph of y = sin ax. Graph of y = cos x. Graph of y […]
You are browsing archives for
Category: Cambridge Maths A
Trapezoidal Rule-2
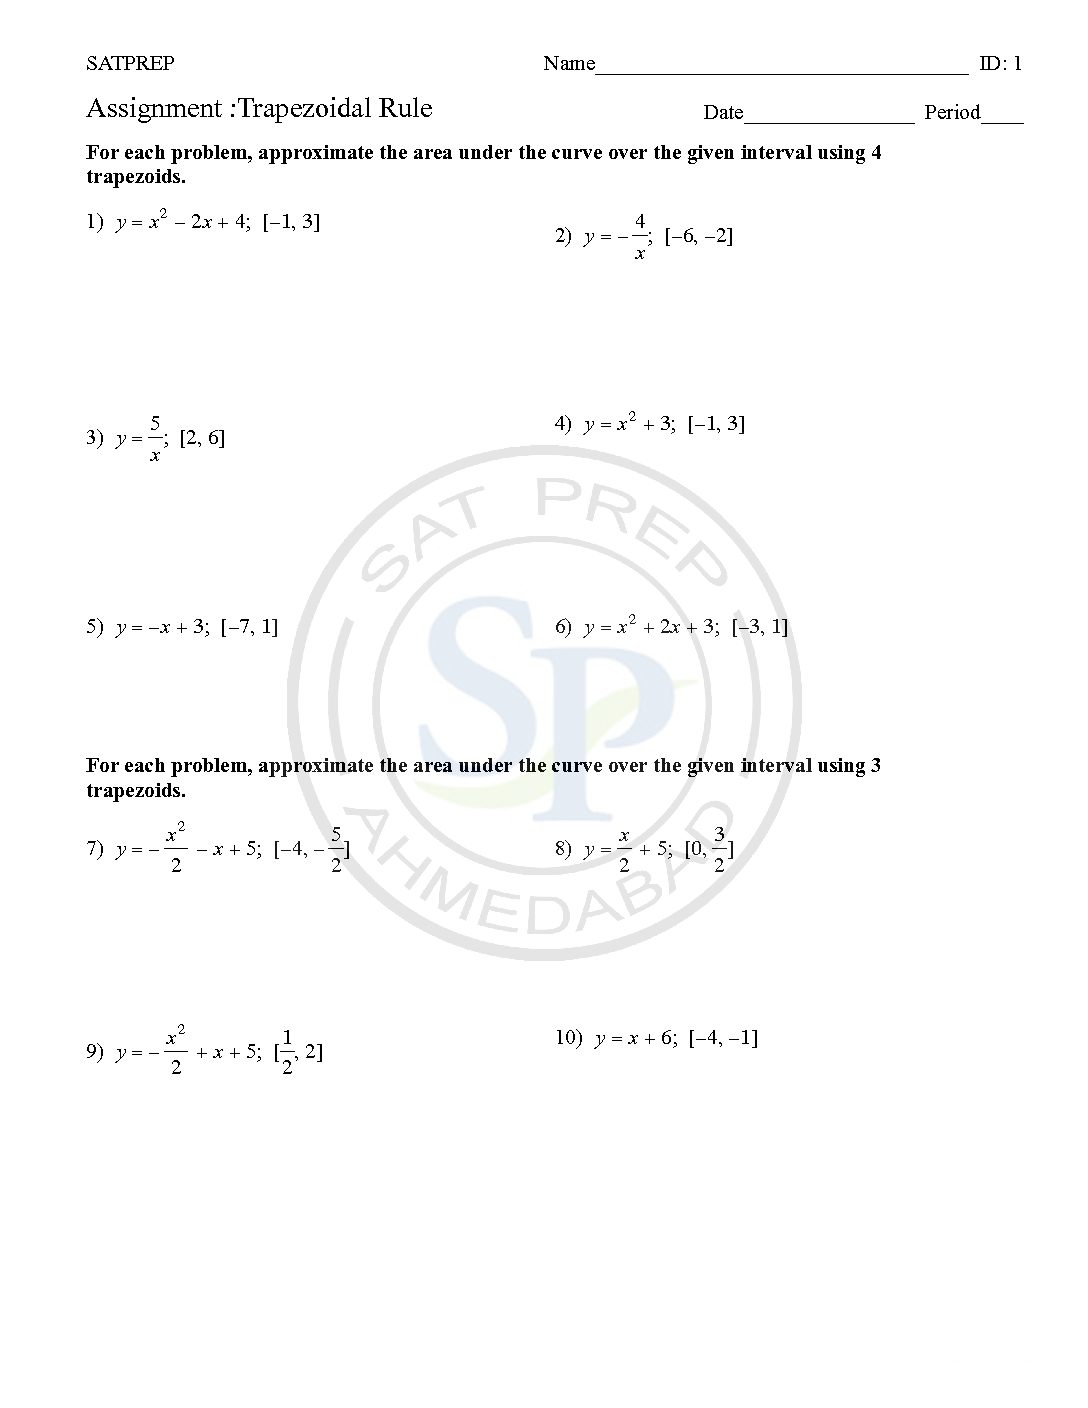
trapezium rules is a way of estimating the area under a curve. so the trapezium rule gives a method of estimating integrals. Due to this we get approximate answer . Also we can get area using integration. trapezium rule
Trapezoidal Rule
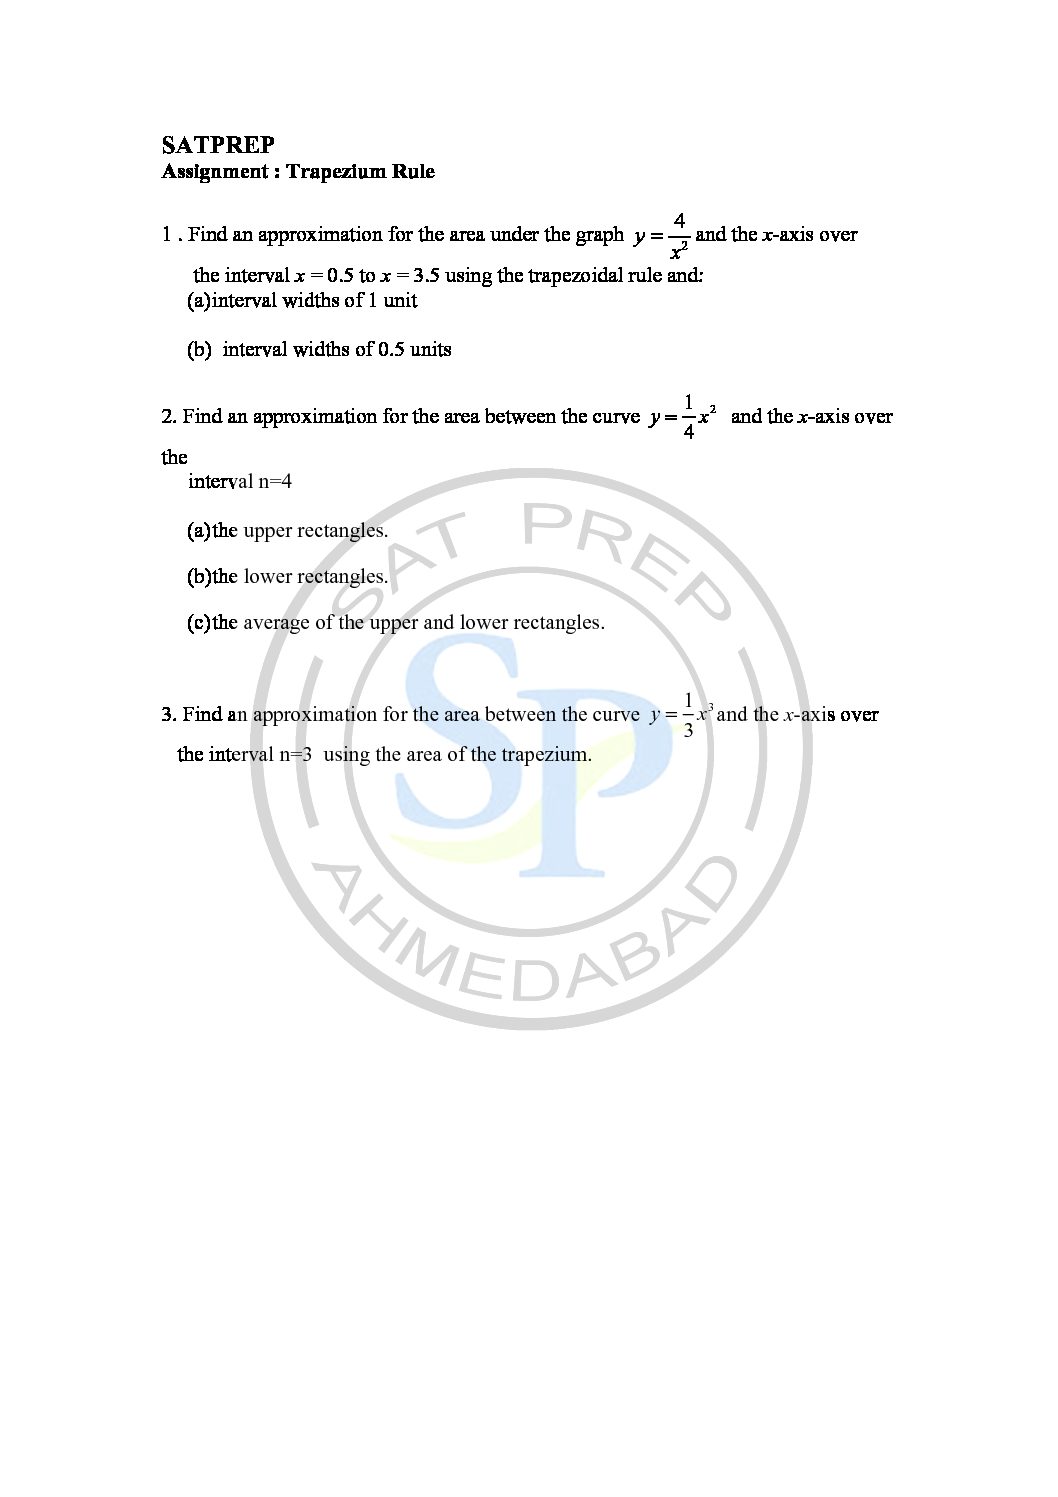
The trapezium rules is a way of estimating the area under a curve. so the trapezium rule gives a method of estimating integrals. Due to this we get approximate answer . Also we can get area using integration. trapezium Rule
Approximating area under the curve
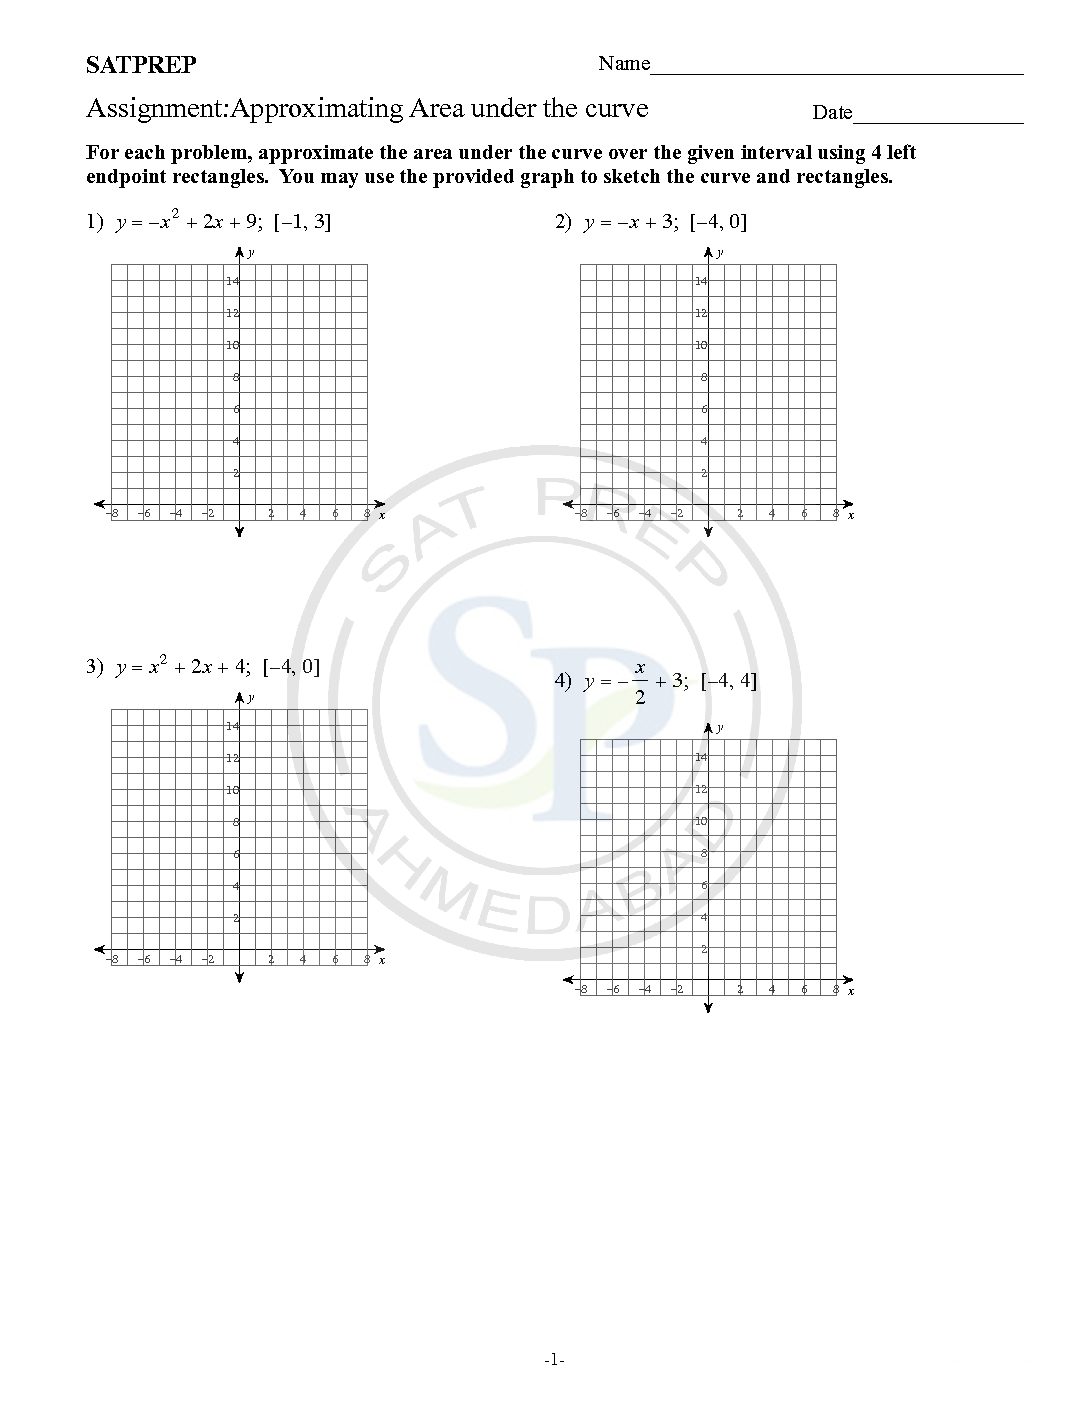
Approximate area of under a curve. Compute left, right, and midpoint Hence Riemann sums use with n rectangles are computed. Due to the this it approximate area. Approximate area under
Probability
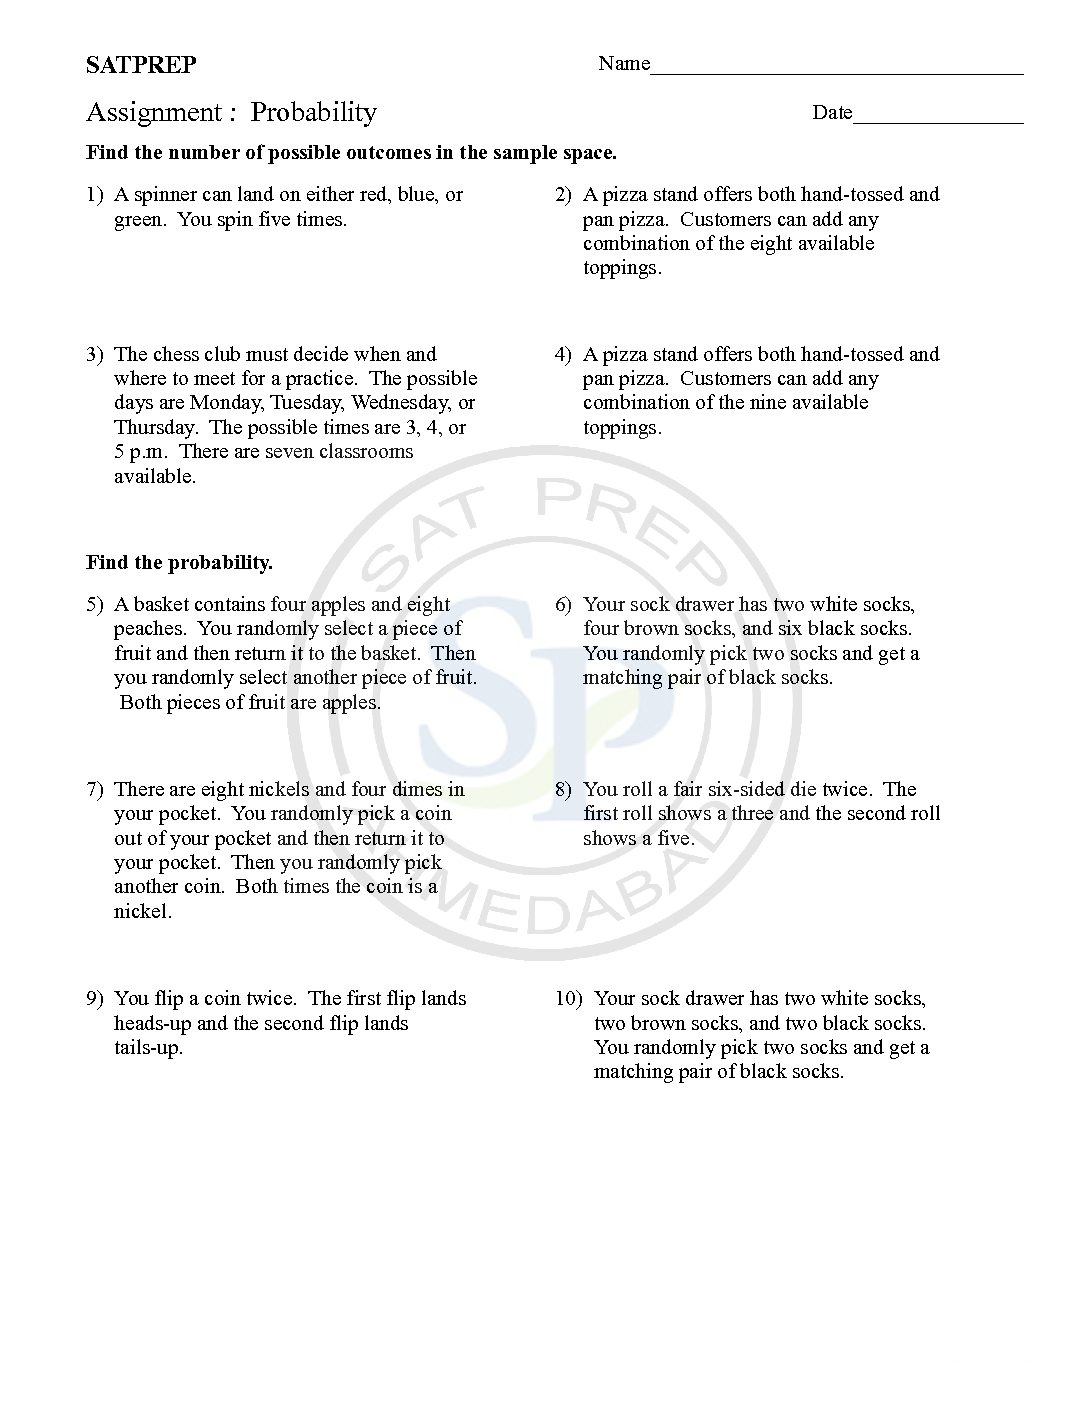
Probabilities is the measure of the likelihood that an event will occur. A number between zero and one that shows how likely a certain event. Another probability of event A is the number of ways event A can occur divided by the total number of possible outcomes. Also expressed by the ratio of the number of actual occurrences […]
Polynomial with complex root
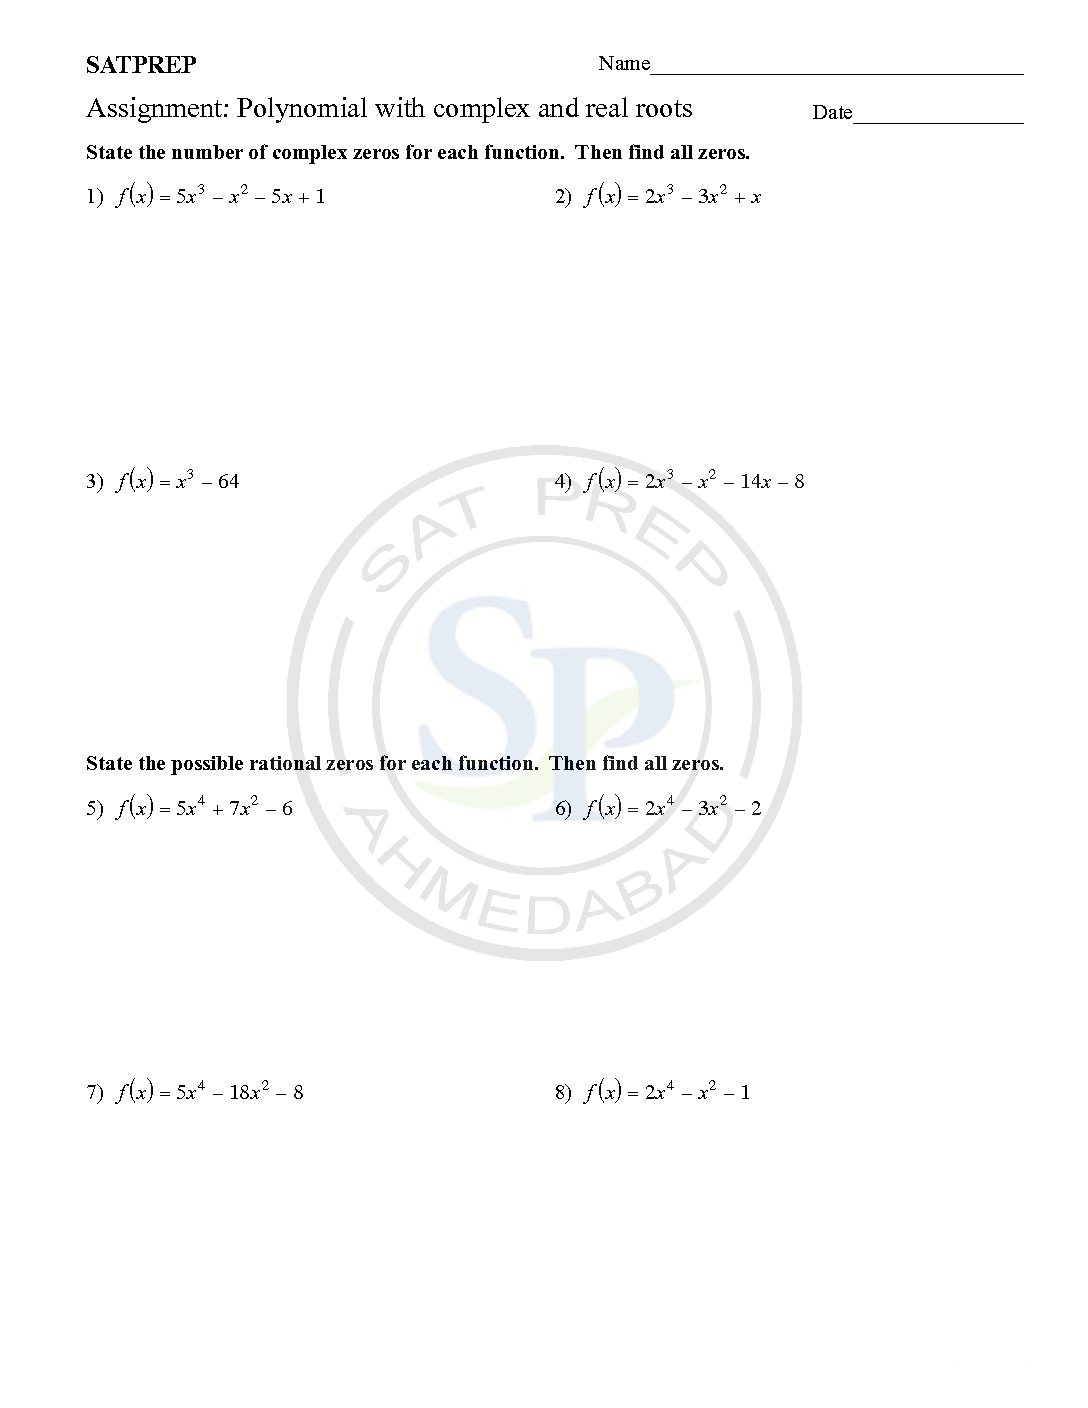
nth degree polynomial with real coefficients has precisely n complex roots . Hence when all root cannot be real. Complex root with Polynomial
Arithmetics of complex no
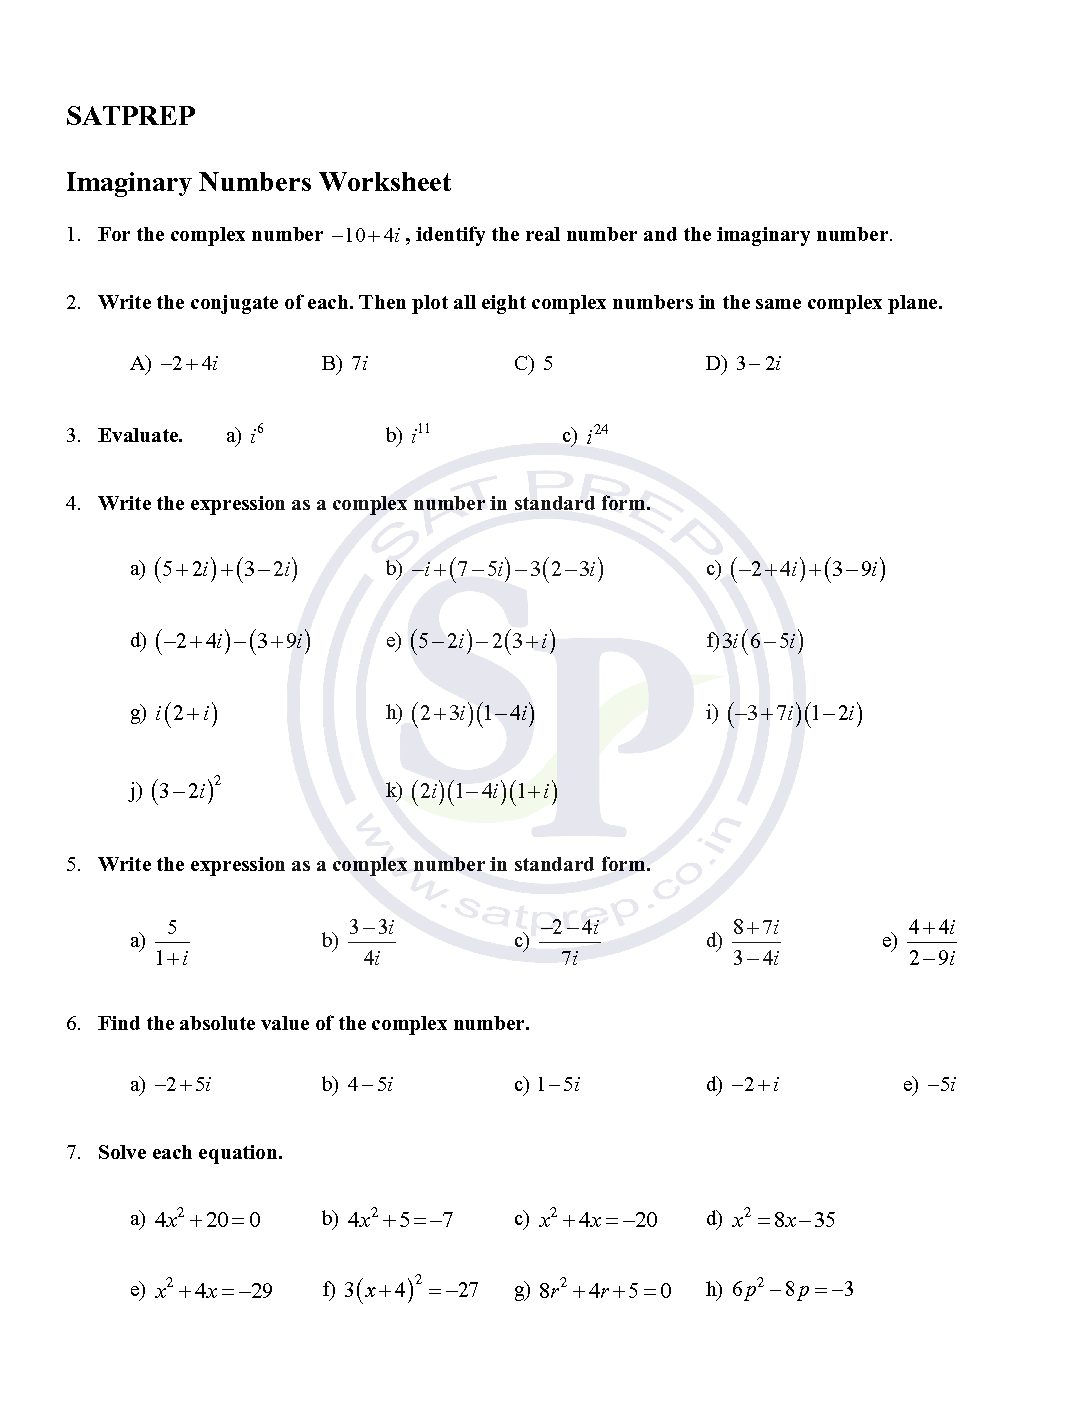
imaginary number is any number of the form a + bi where a and b are real numbers. Addition and Subtraction of complex numbers is to add or subtract real parts and the imaginary parts. complex no
Vector and Scalar product.
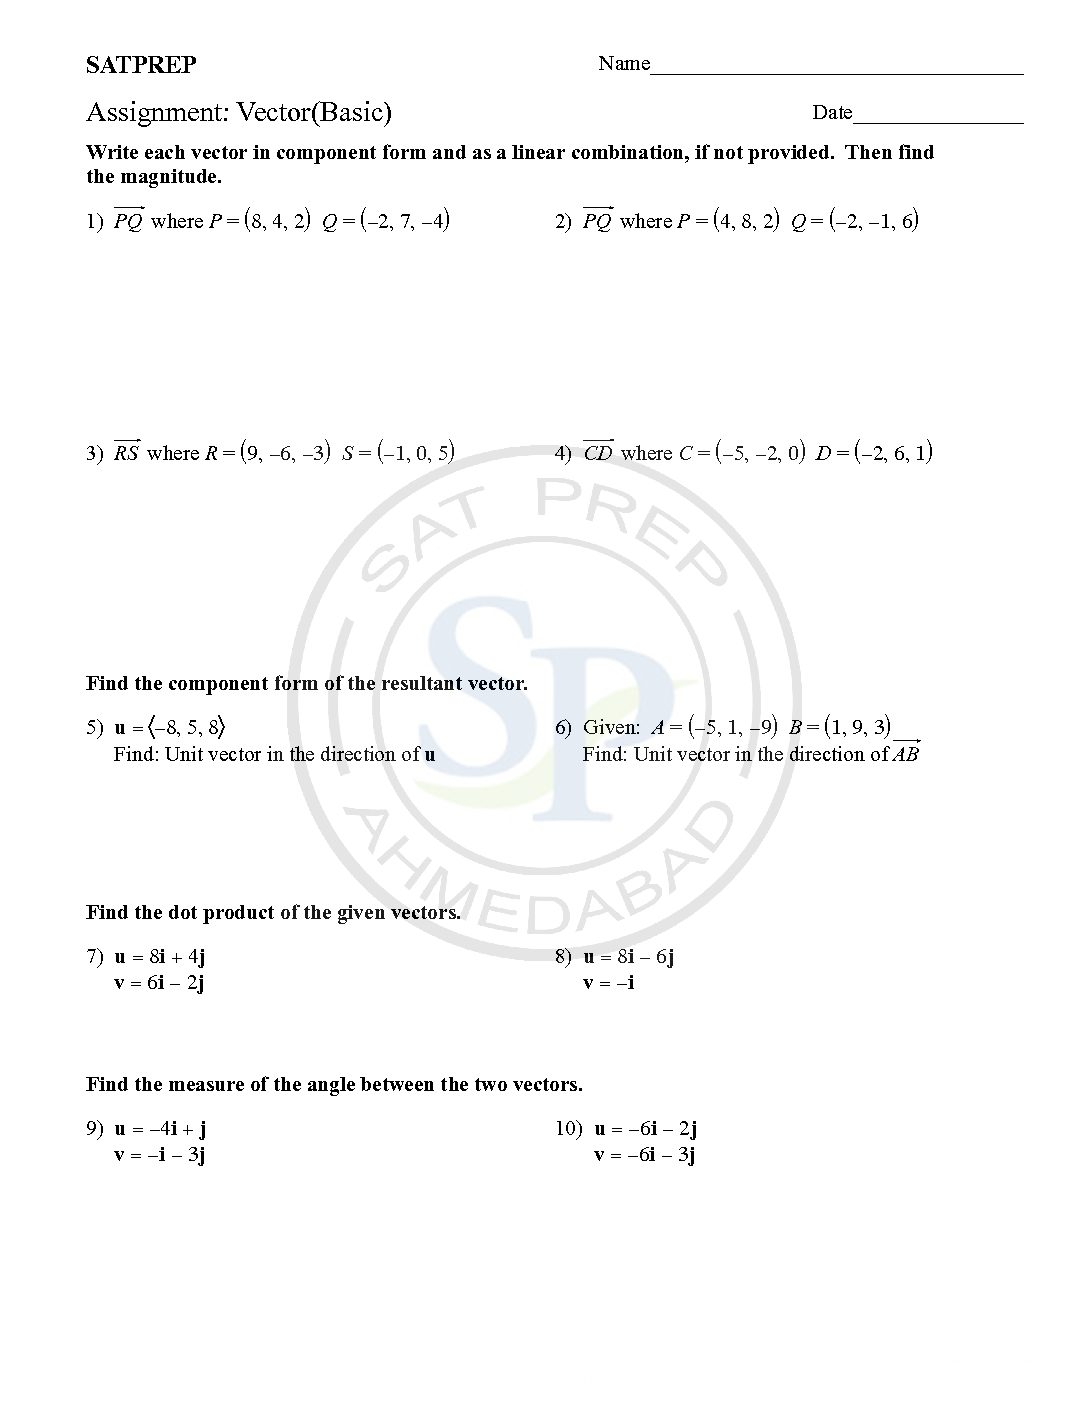
vector has magnitude and direction. It start from one point to another point. The length of vector is called magnitude. The scalar product of two vectors is multiply and obtain a scalar quantity. It represent on ‘dot’. Another name is dot product. Vector and scalar product
Polynomial
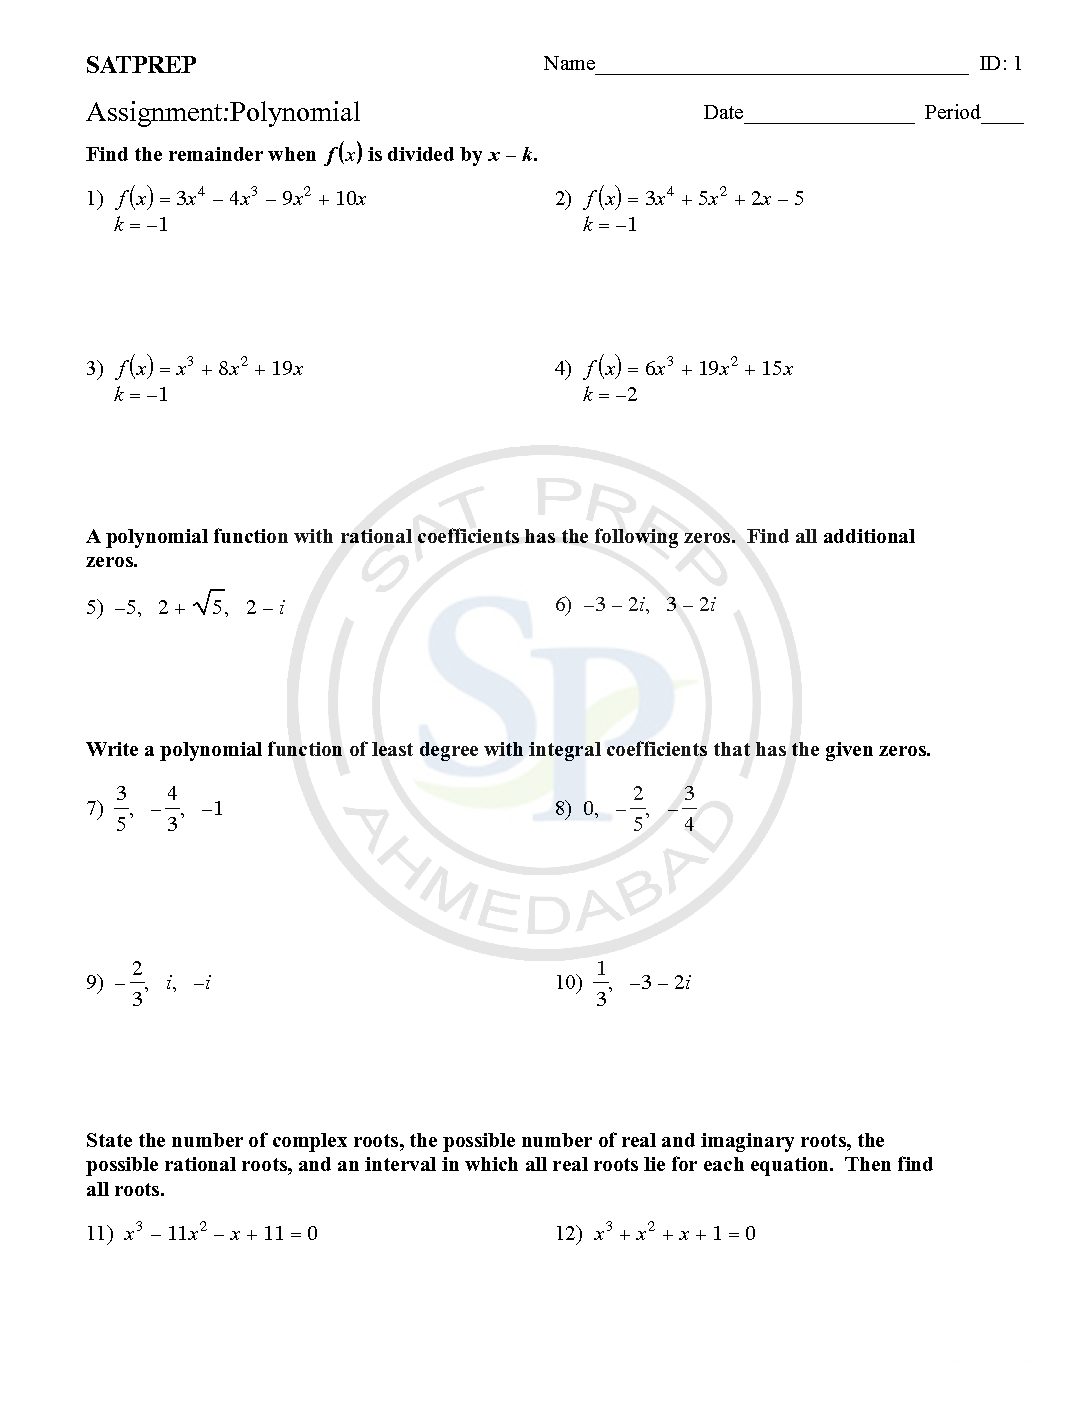
The polynomials are an expression involving a sum of powers in one or more variables multiplied by coefficients and constant. Polynomial linear , quadratic etc as per value of n=1, n = 2 etc . We can graph the polynomial for finding solution. Another polynomial is also use for curve as well as st. line. As […]
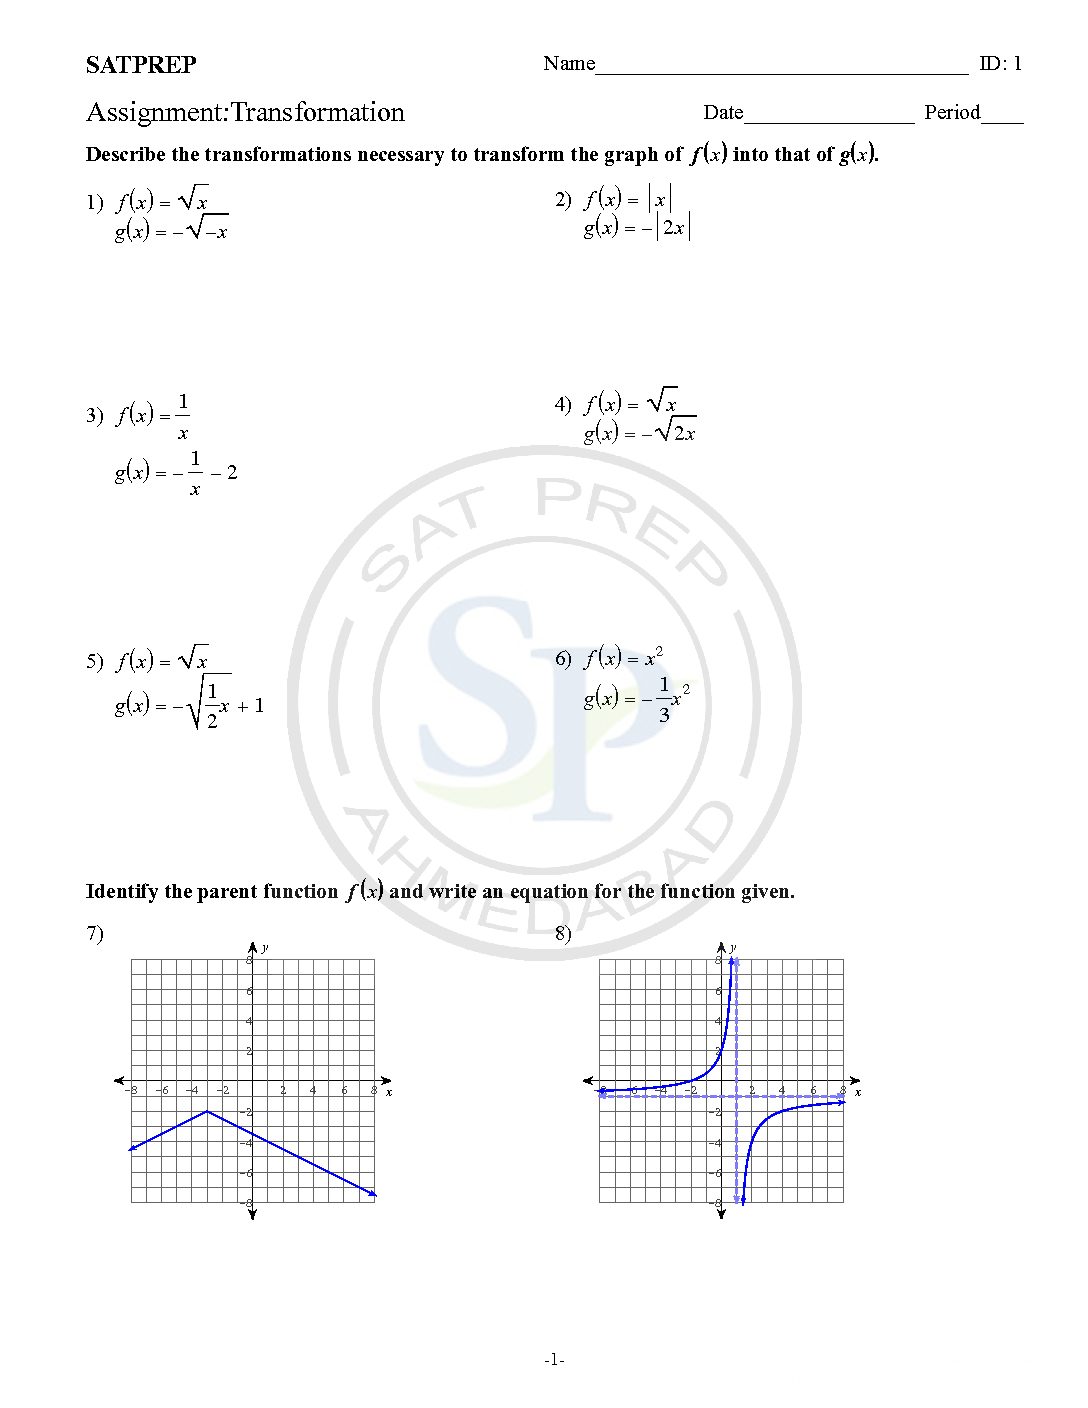
Transformation
In this post question are from transformation of function. It basically deals with translation of functions through vector . Also it deal with reflection . Transformation
