F(x) represent function. Mostly , functions are portrayed as a set of x/y coordinates. Therefore y-axis serving as a function of x. When we use function F(x) notation then one is independent variable and another dependent variable. Due to this on Y-axis F(x) represent. Functions
You are browsing archives for
Category: IB Maths SL
Domain and Range
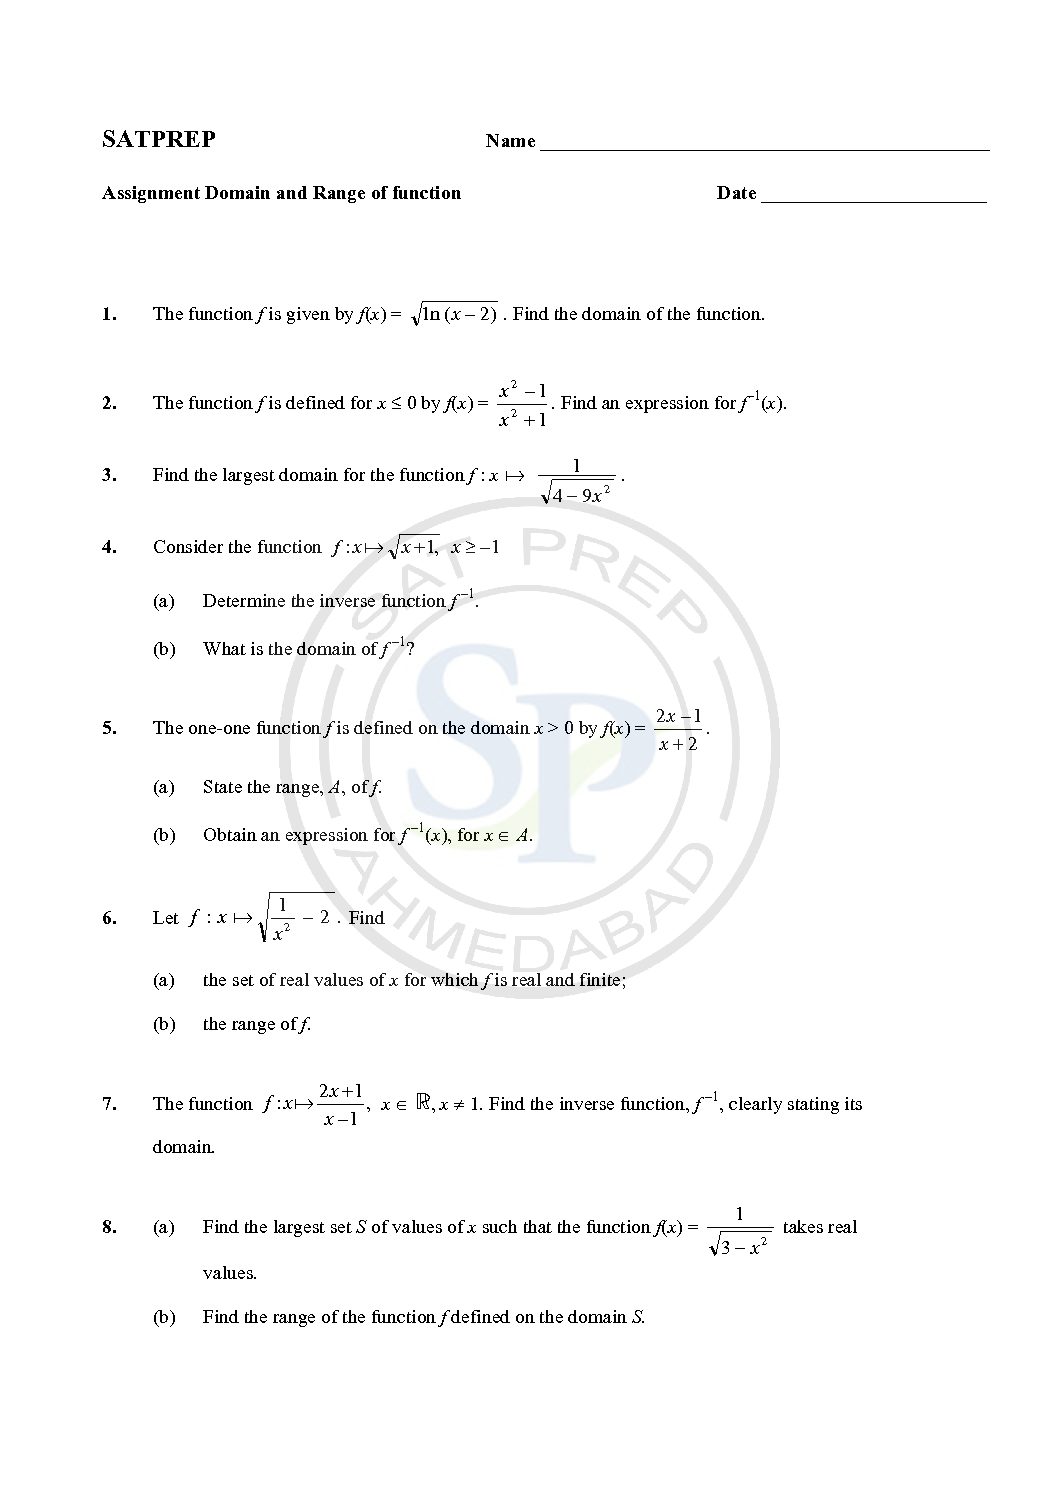
Domain represent value of x , while range represented by F(x) or y function. Mostly , functions are portrayed as a set of x/y coordinates. Therefore y-axis serving as a function of x. When we use function F(x) notation then one is independent variable and another dependent variable. Due to this on Y-axis F(x) represent. Domain and range
Area of triangle
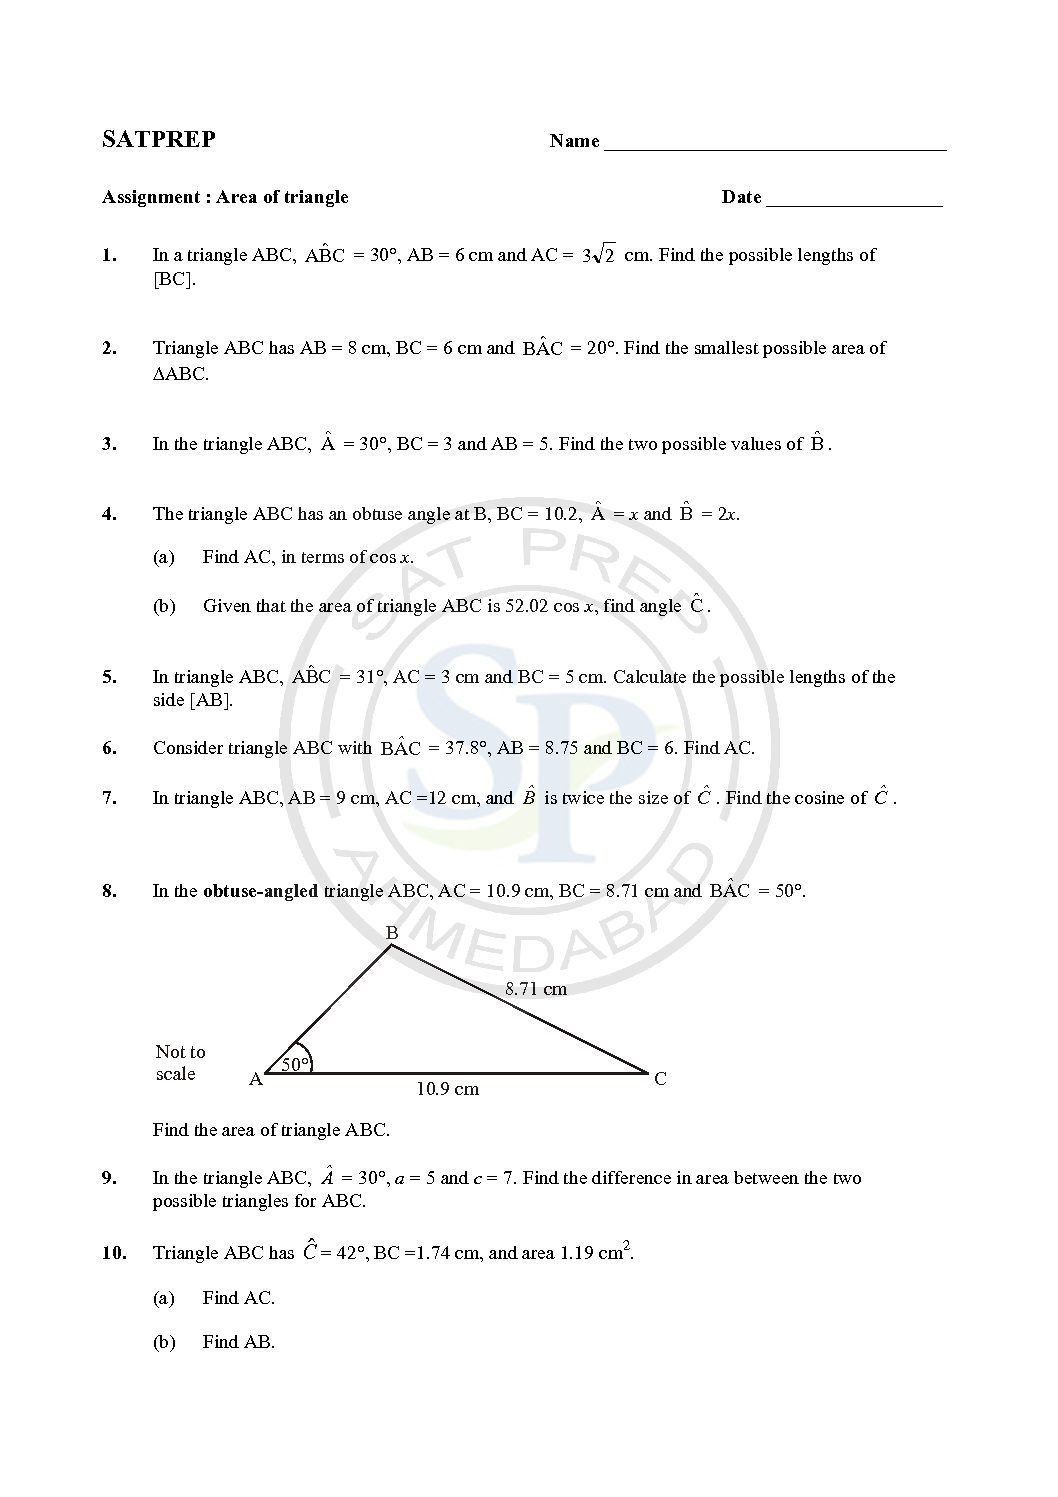
Area of Triangles Without Right Angles. There are several ways to find the area of a triangle. When we know the base and height it is easy. therefore the area also equals half of ab sin C. Area of triangle
Trigonometric Equation
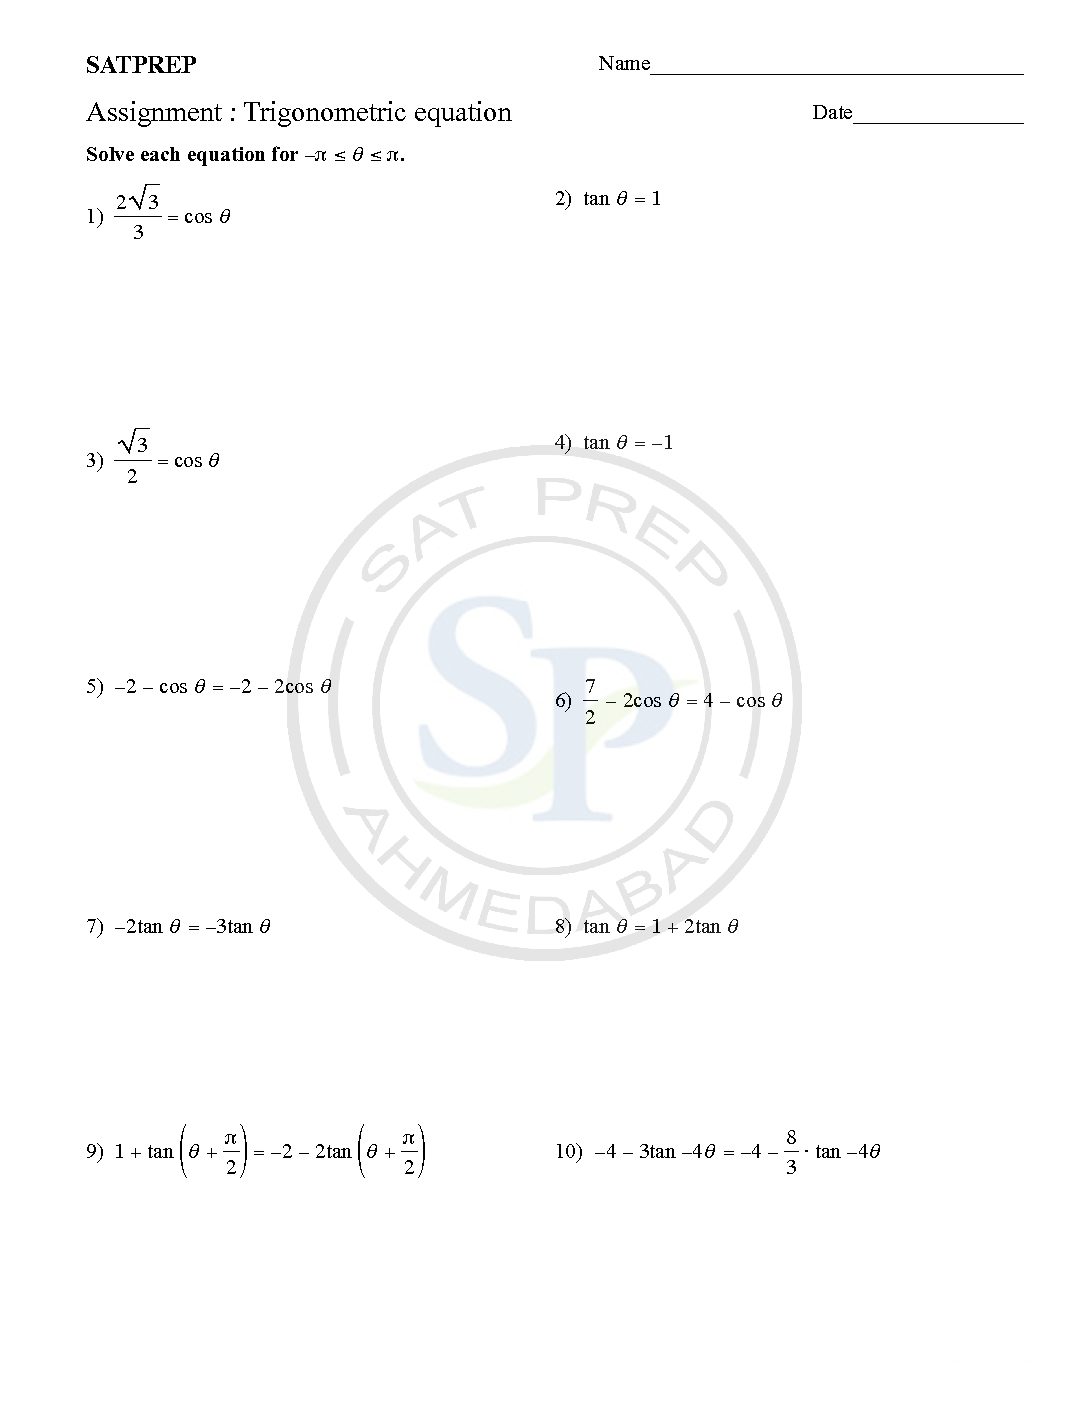
Solving trig equations use both the reference angles and trigonometric identities The general method of solving an equation is to convert it into the form of one ratio only. Then, using these results, hence, we can obtain solutions. Trigonometric equation
Binomial distributions
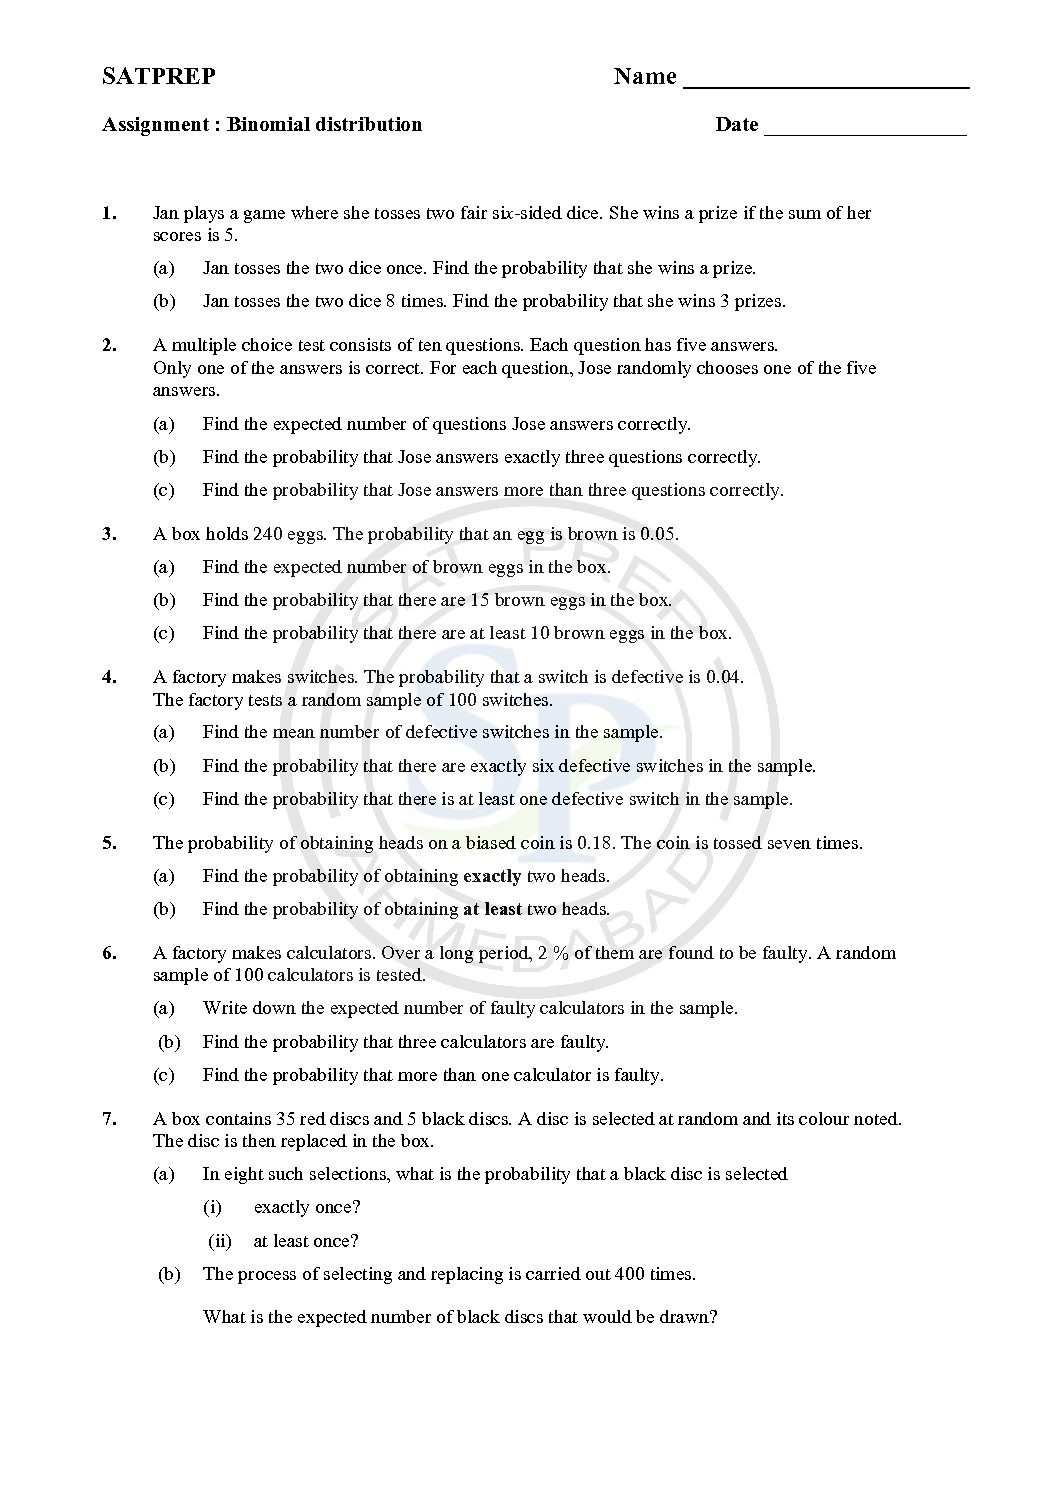
This post is about binomial distributions. The Binomial distribution has two parameters like n and p. Due to n and p it is binomial. these n and p are n and p is the discrete probability distribution of the number of successes in a sequence of n independent experiment. Also we use probability of failure. Binomial
Vector and vector equation of line
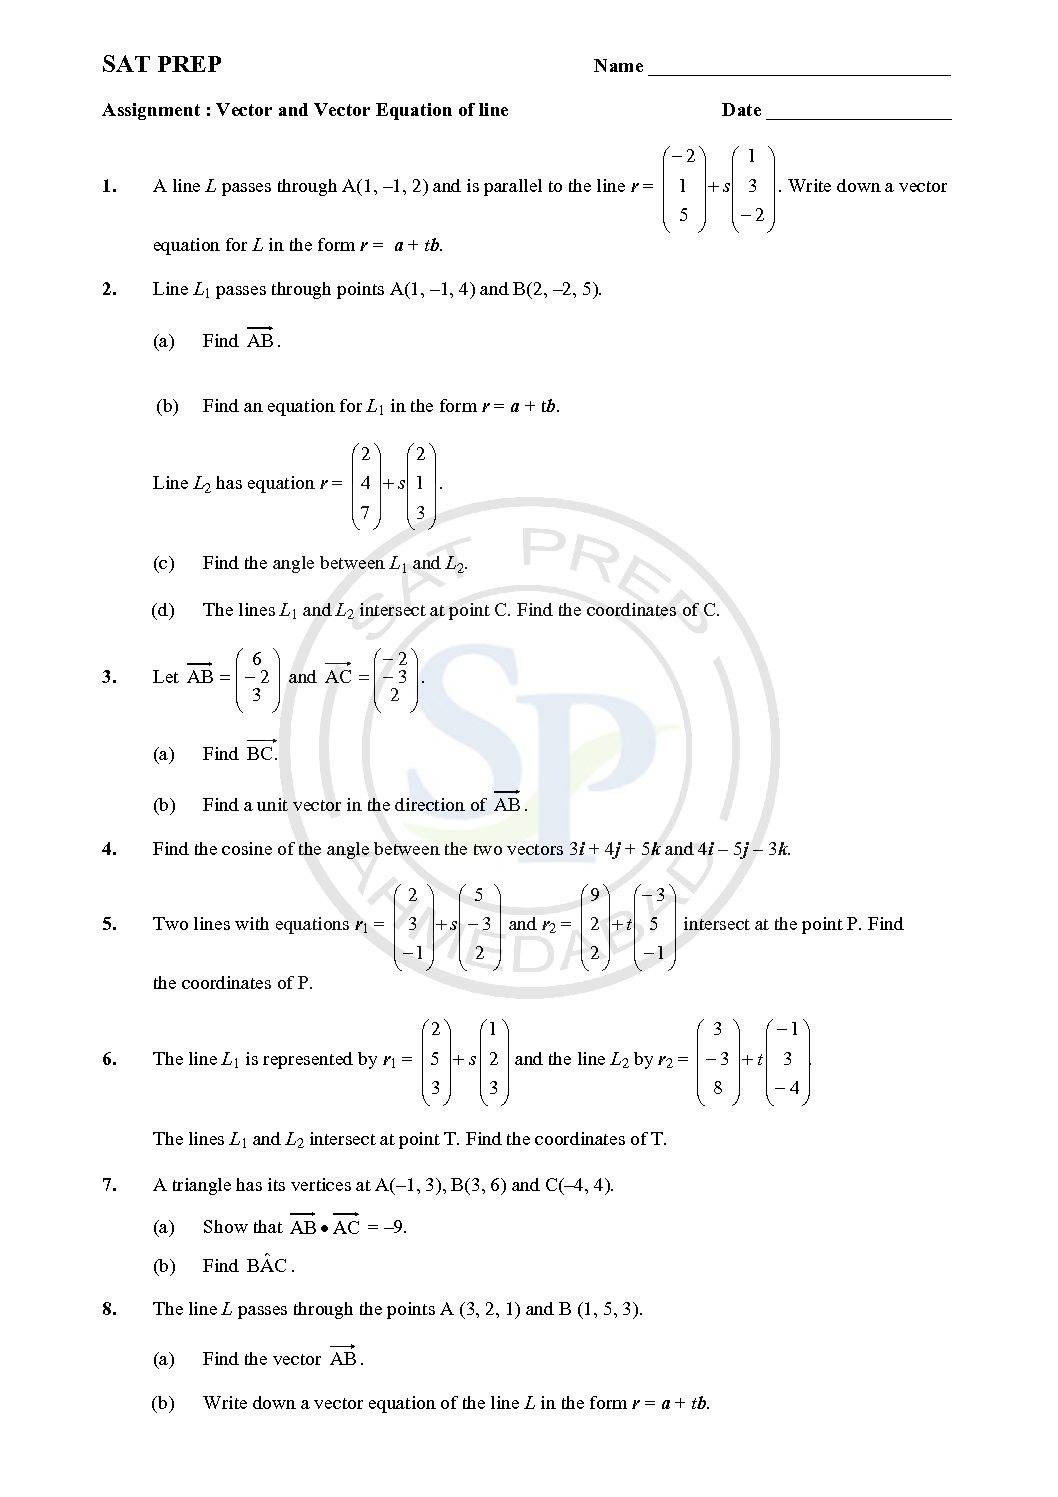
The vector is direction one point to another point. The vector equation of a line is r = a + tb. In this equation, “a” represents position vector and “b” represents a direction vector of the line. Moreover “r” represents the vector of any general point on the line and “t” is constant. Hence it is similar to equation of line vector
Normal Distribution
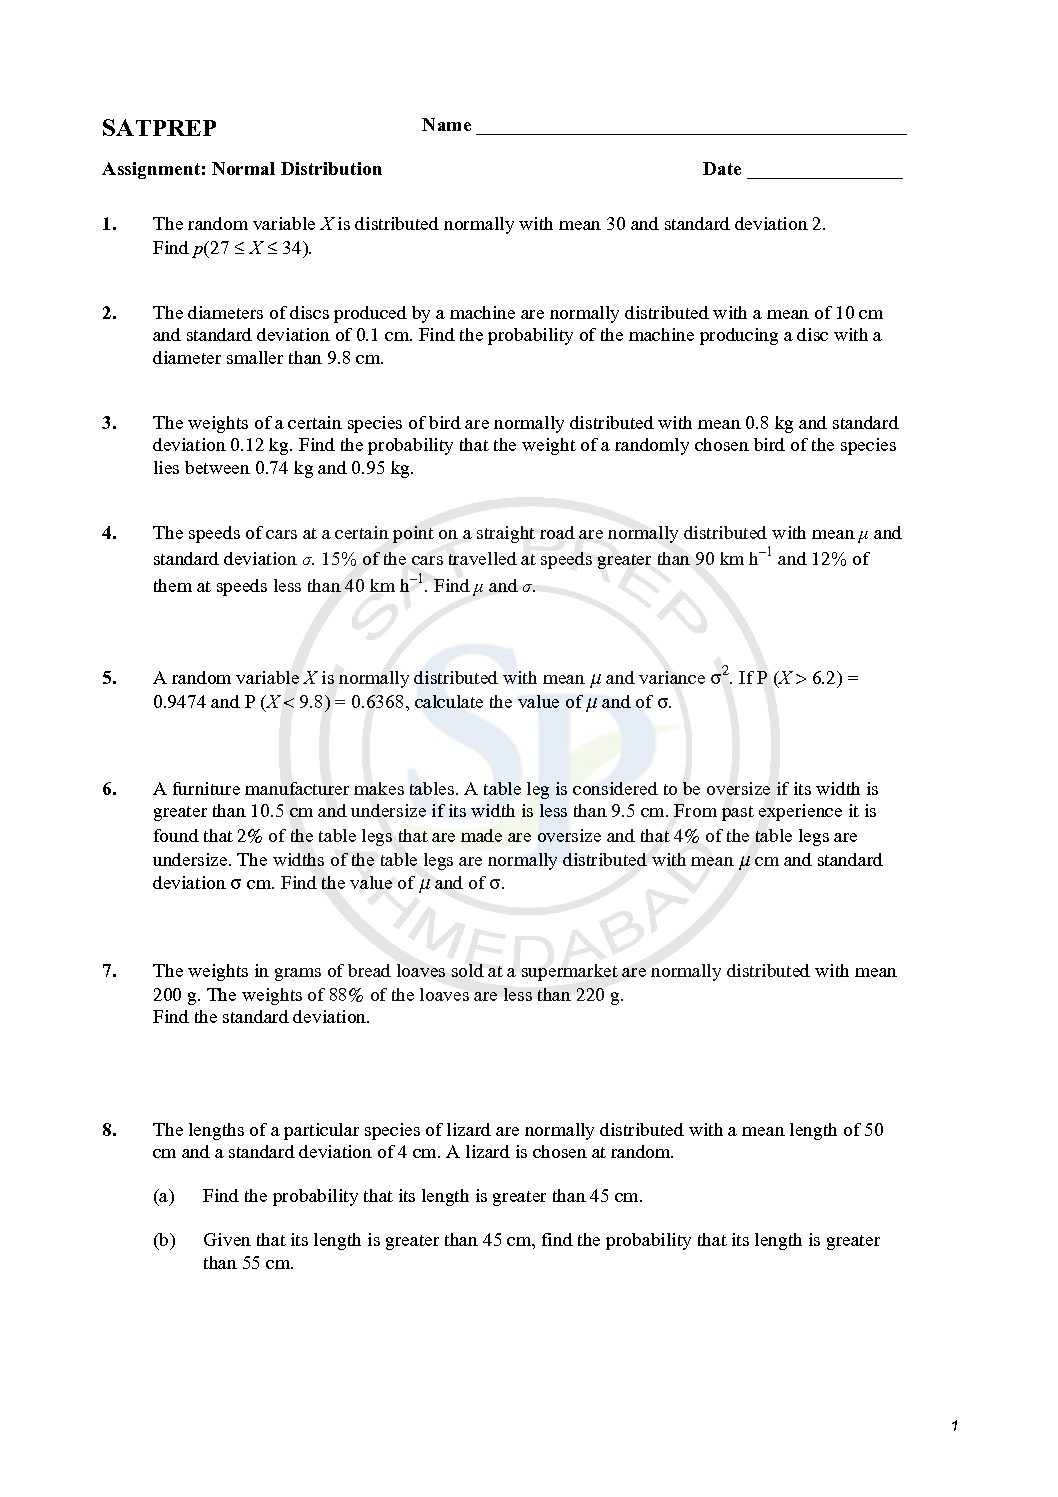
A graphical representation of a normal distributions are sometimes called a bell curve because of its flared shape. The precise shape can vary according to the distribution of the population but the peak is always in the middle and the curve is always symmetrical. In a normal distribution, the mean, mode and median are all the same. The Normal distribution has two […]
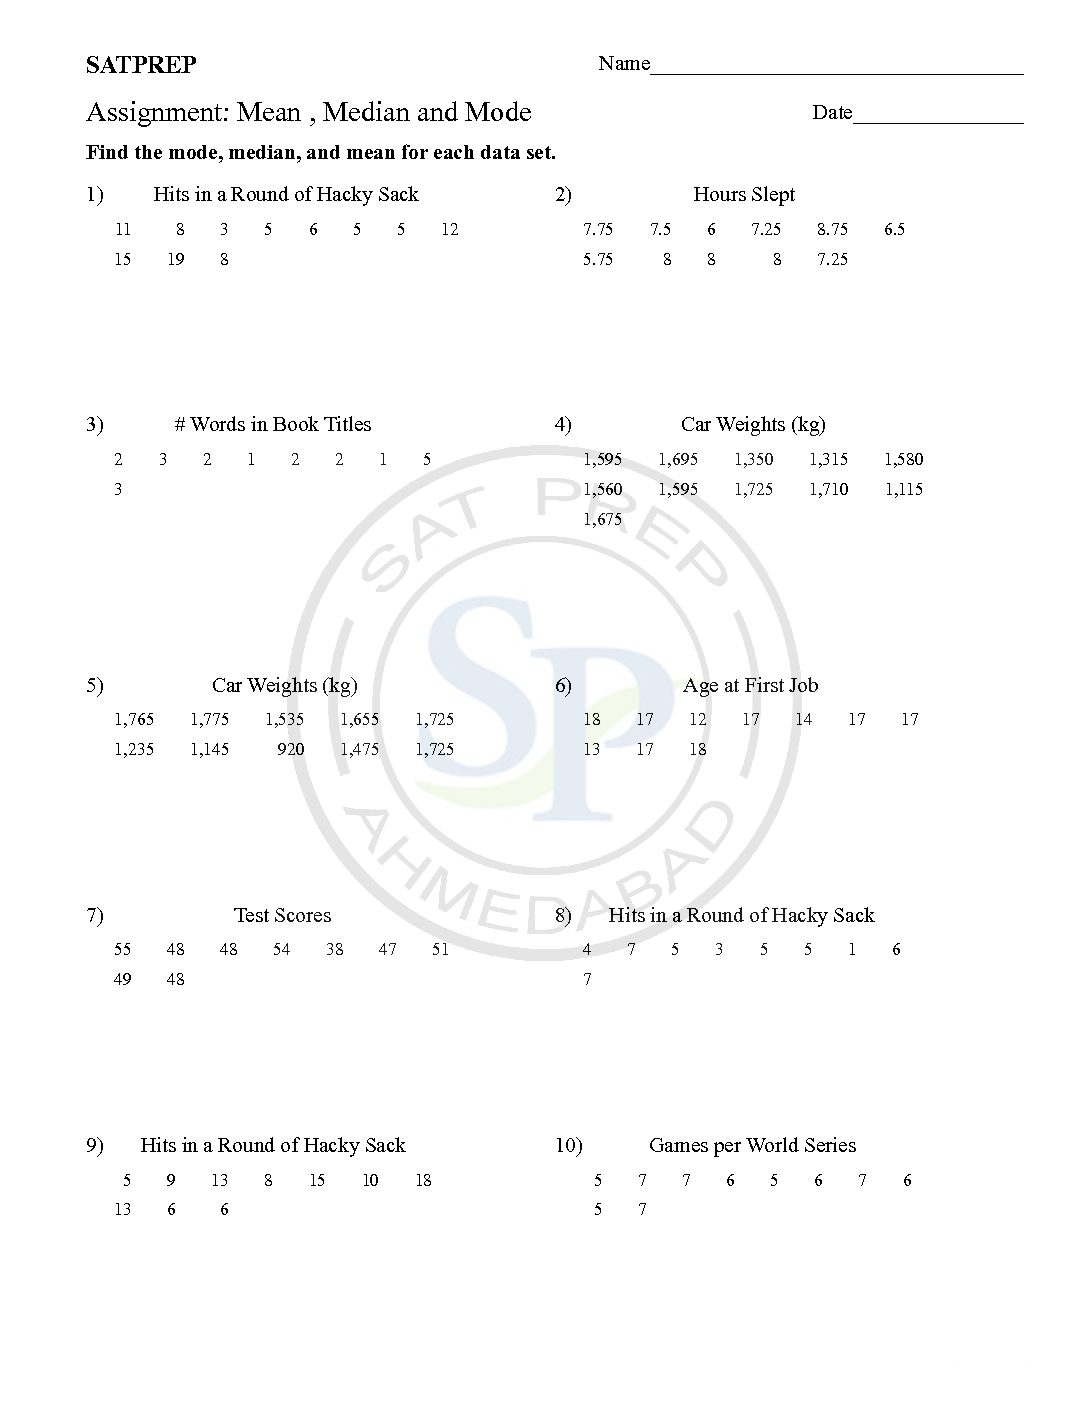
Mean , Median and Mode
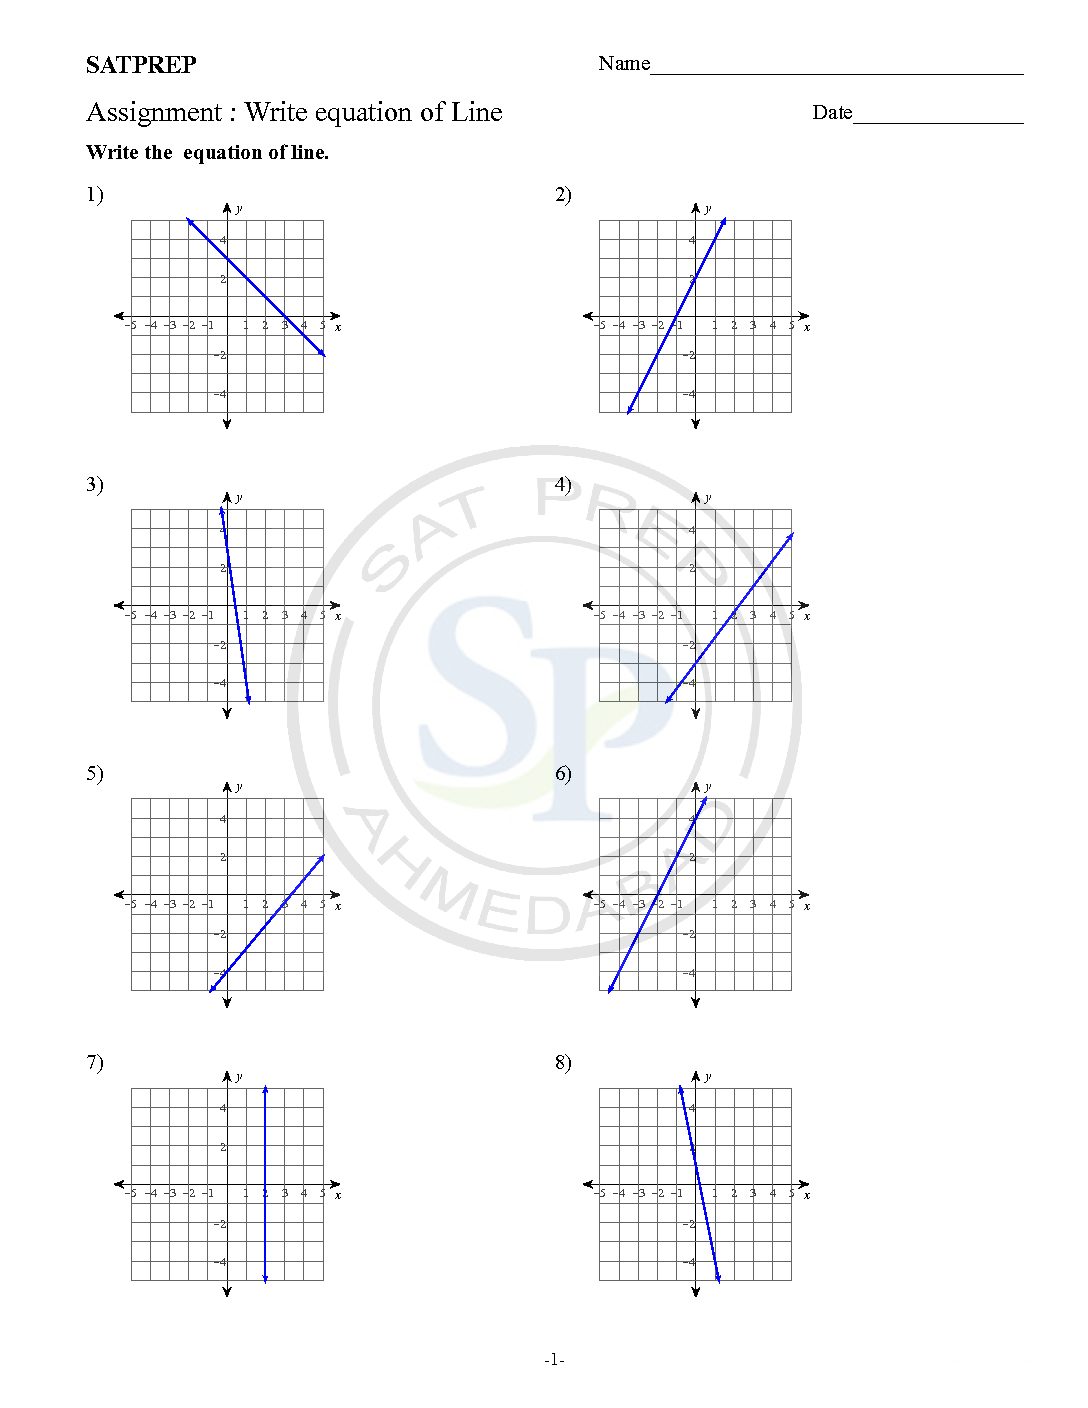
Equation of line
Maxima and minima
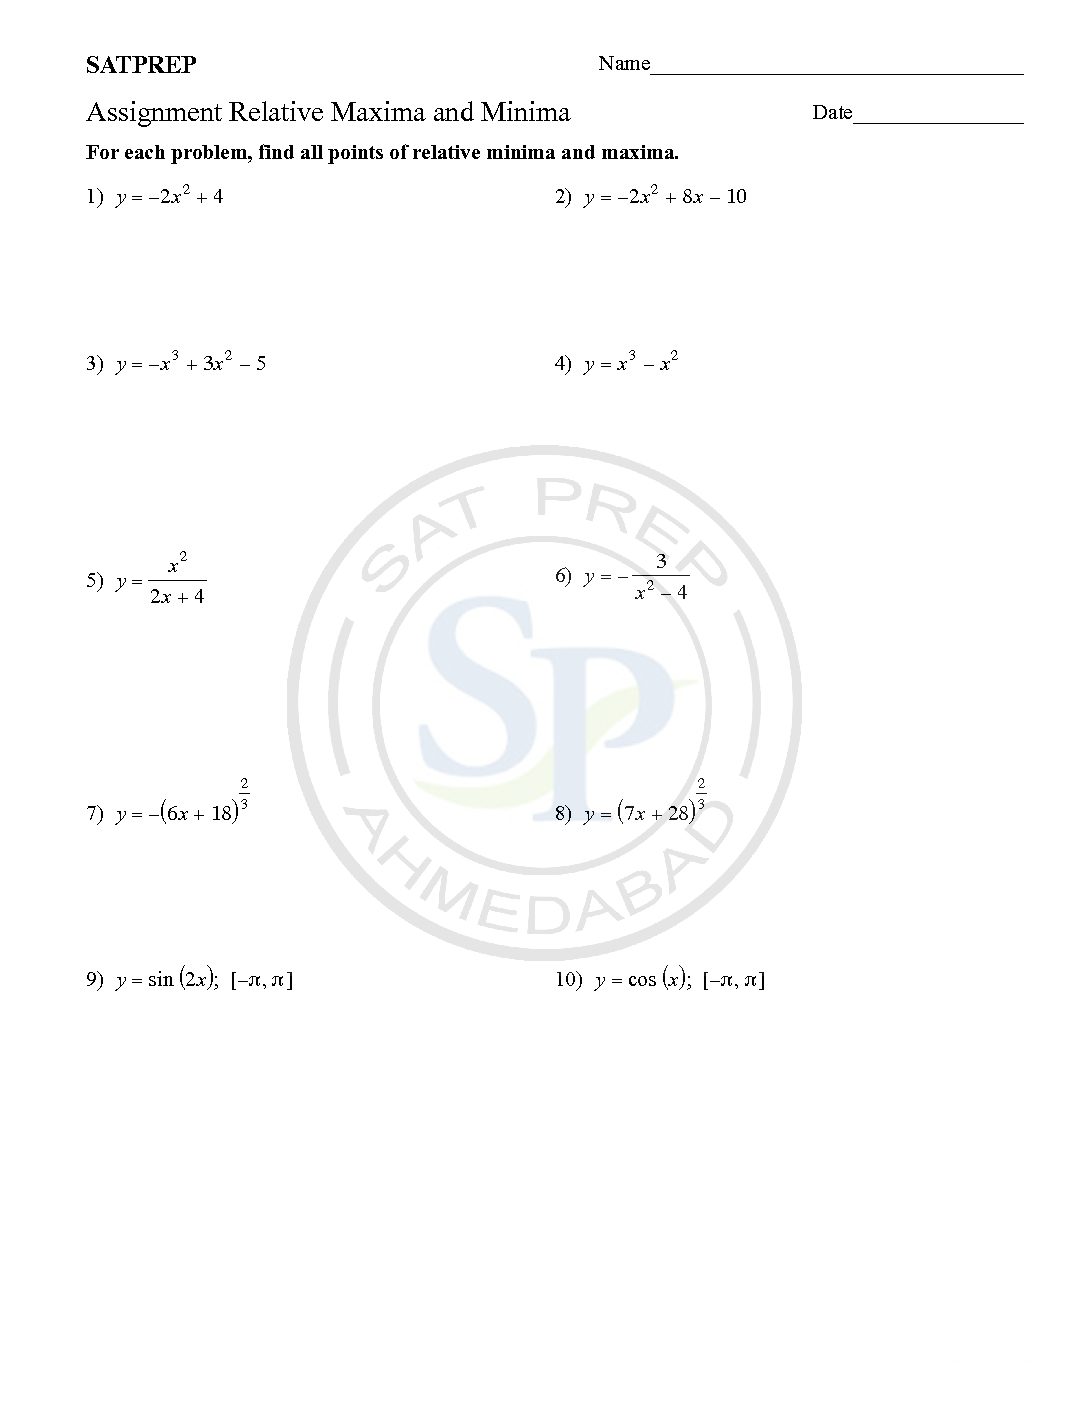
A high point of curve is called a maxima. A low point is called a minima. In the Curve only one global maxima or minima exists , while more than one local maximum or minimum. Due to curve turn on these point are called local. Hence these point also called stationary points. Maxima and minima