Combinations and permutation and is a very important topic of mathematics as well as the quantitative aptitude section. In permutation we arrange object while in combination we select items. Permutation and combination
You are browsing archives for
Category: IB/Cambridge
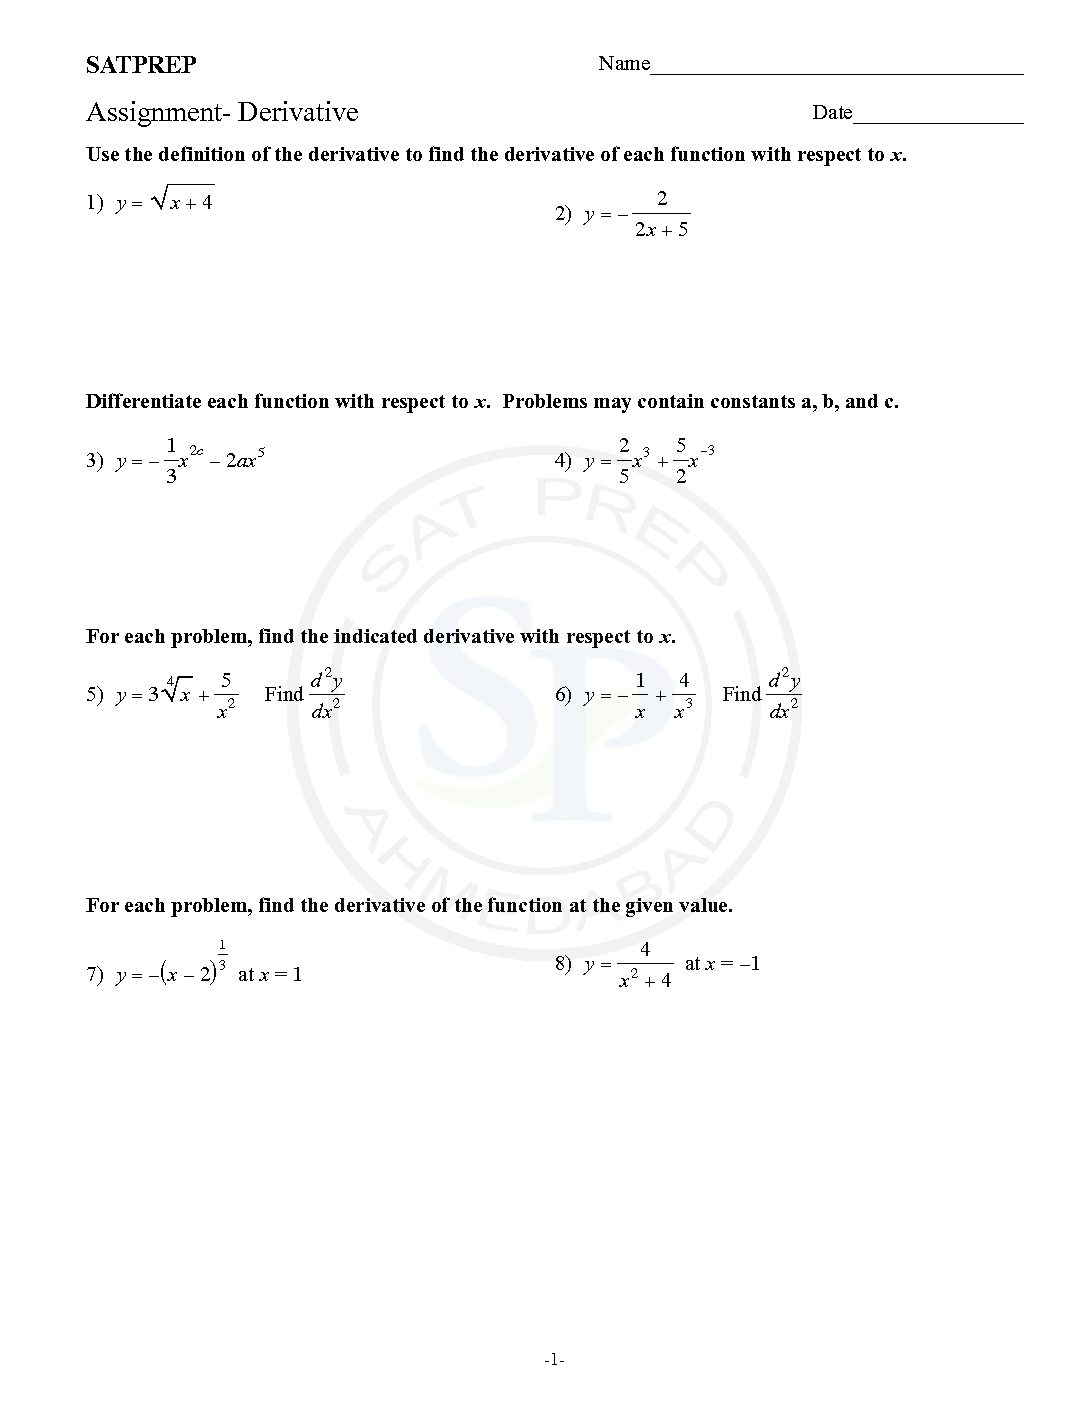
Derivative
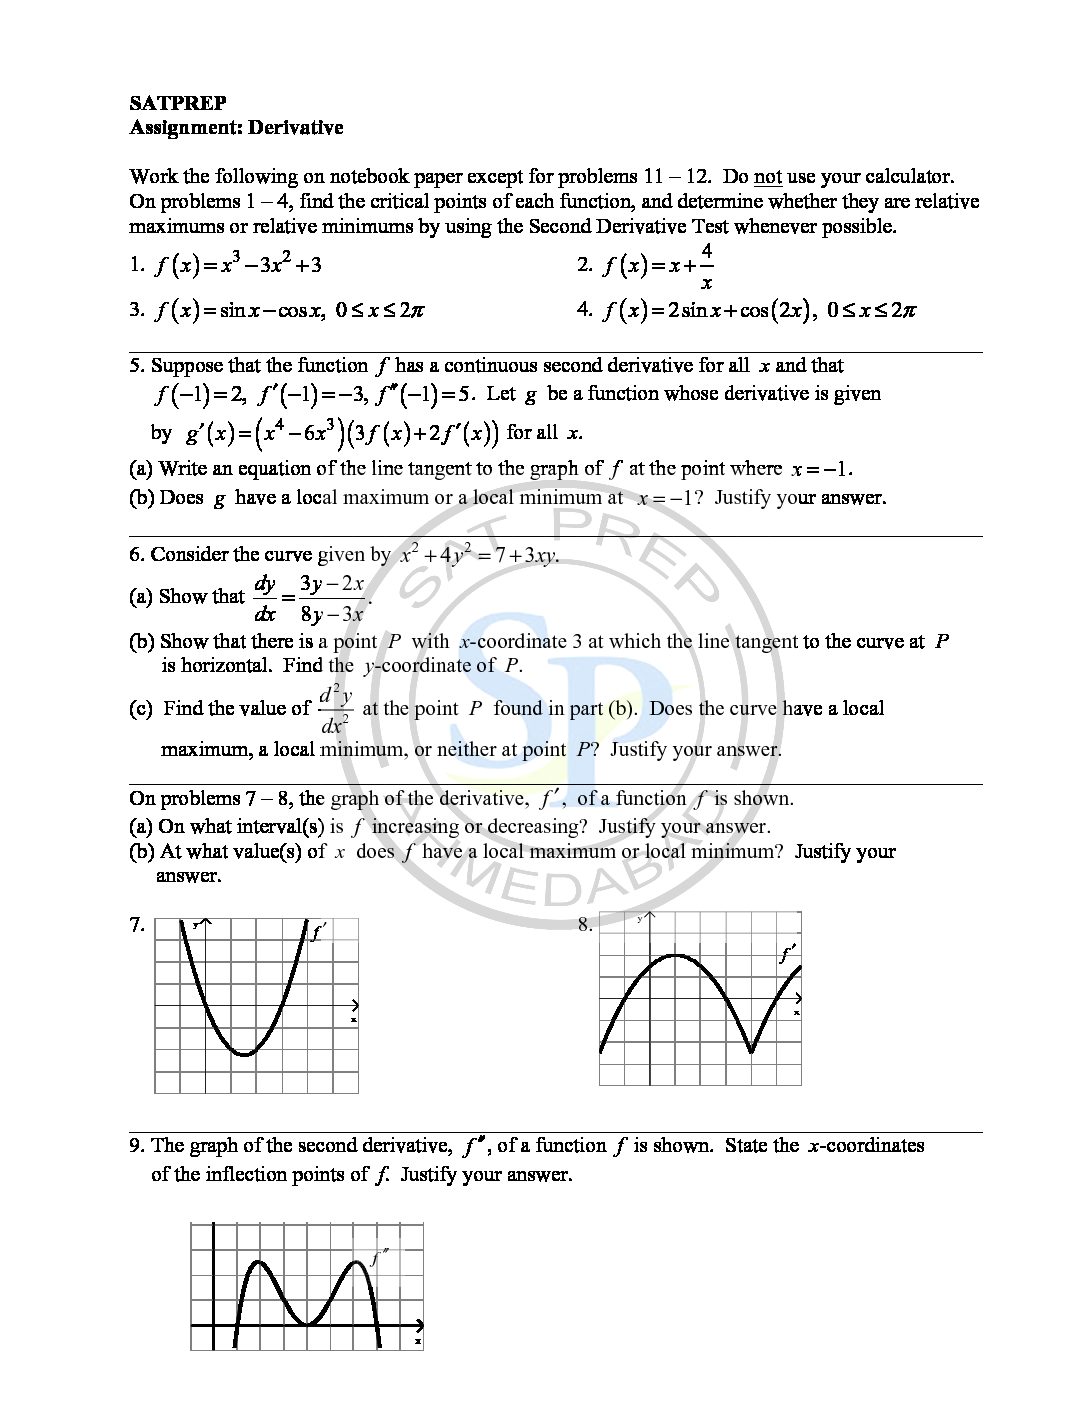
The derivative of a function of a single variable at a chosen input value. Derivative is the slope of the tangent line to the graph of the function at that point. Hence derivative of a function y = f(x) of a variable x is a measure of the rate at which the value y of the function changes with respect to the change […]
Curve sketching
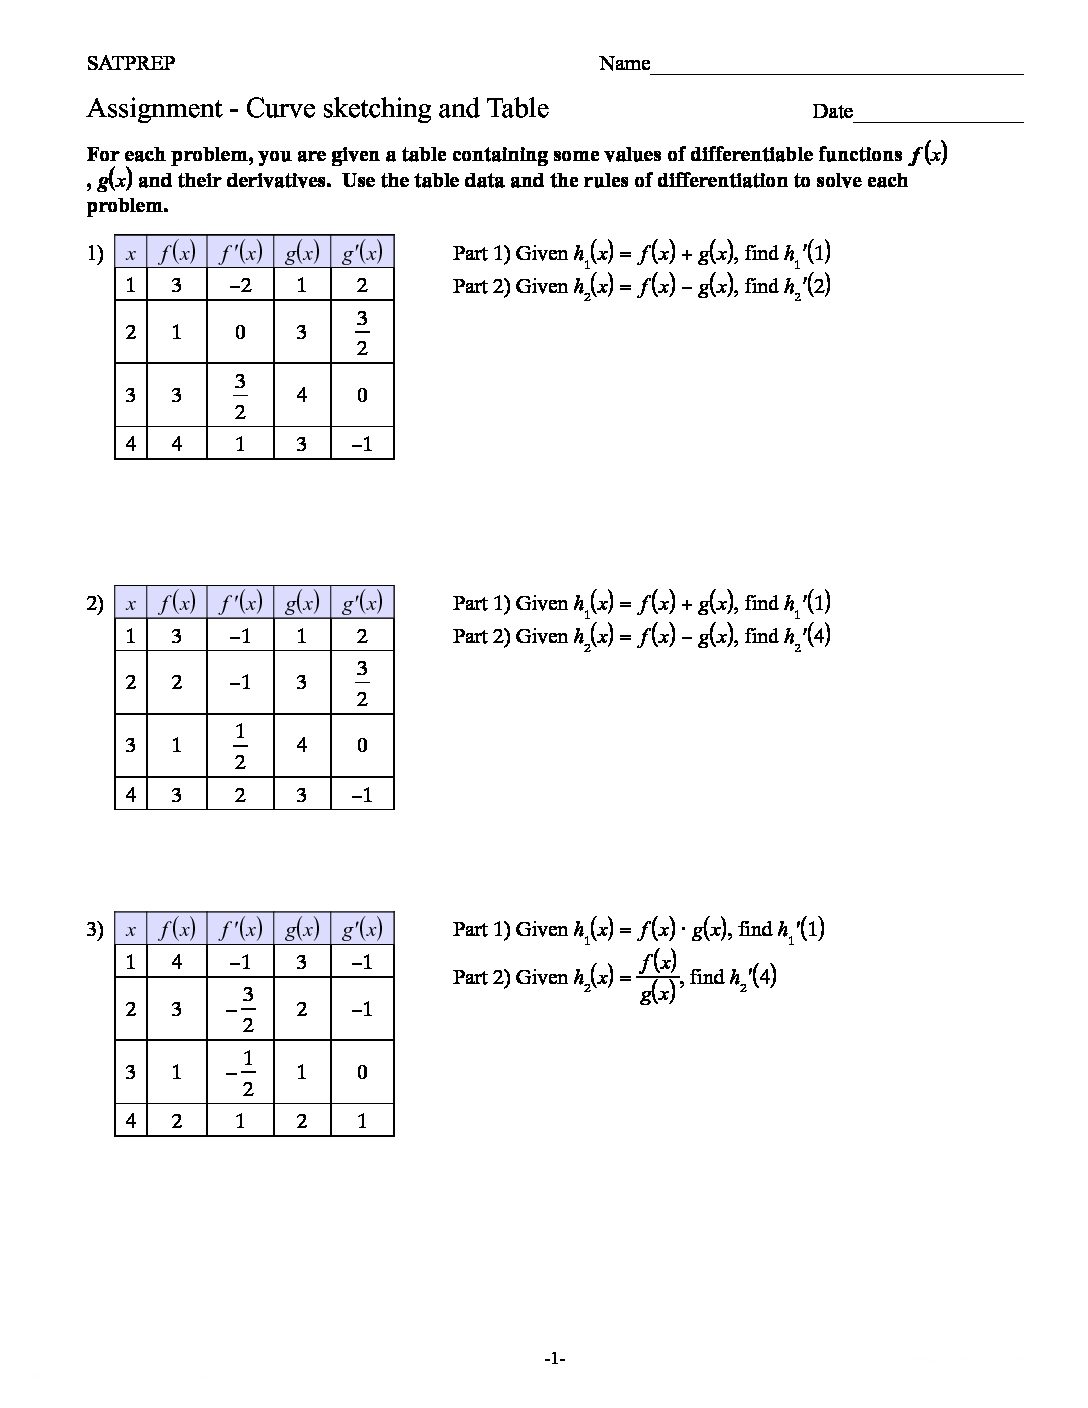
Curve Sketching. If f (-x) = -f (x) for all x in the domain, then f is odd and symmetric about the origin. d) Asymptotes: Find the asymptotes of the function using the methods described above. First attempt to find the vertical and horizontal asymptotes of the function. Curve sketching
Curve Sketching -2

the sketching of curve though coordinate of turning and axes intercepts . So equation of the curve is given. Curve sketching
Curve sketching

Coordinate of turning point and axes intercepts for the sketching of curves though . So equation of the curve is given. Curve sketching
Rolle’s and MVT
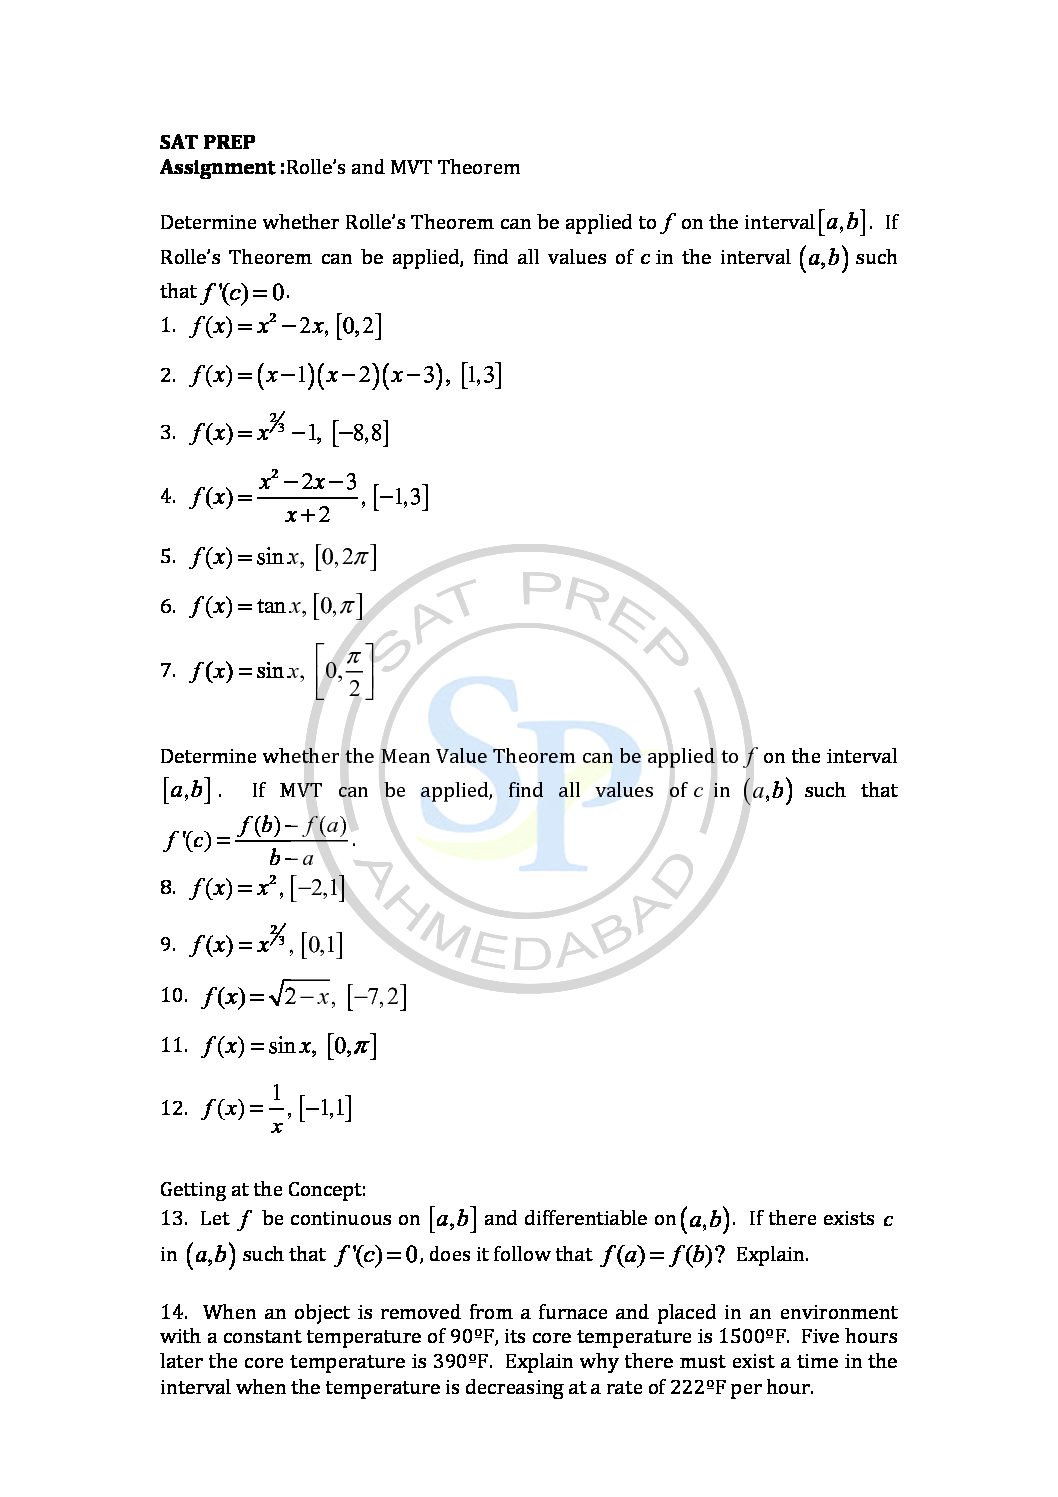
Rolle’s Theorem. Then there is a number c such that a<c<b and f′(c)=0. Or, in other words f(x) has a critical point in (a,b). To see the proof of Rolle’s Theorem see the Proofs From Derivative Applications . Roll’s theorem
Derivative of polynomials
Derivative is product of differentiation. Differentiation has applications to nearly all quantitative disciplines. For example, in physics, the derivative of the displacement of a moving body with respect to time is the velocity of the body, and the derivative of velocity with respect to time is acceleration. Therefore differentiation is process Derivative
Optmization-3
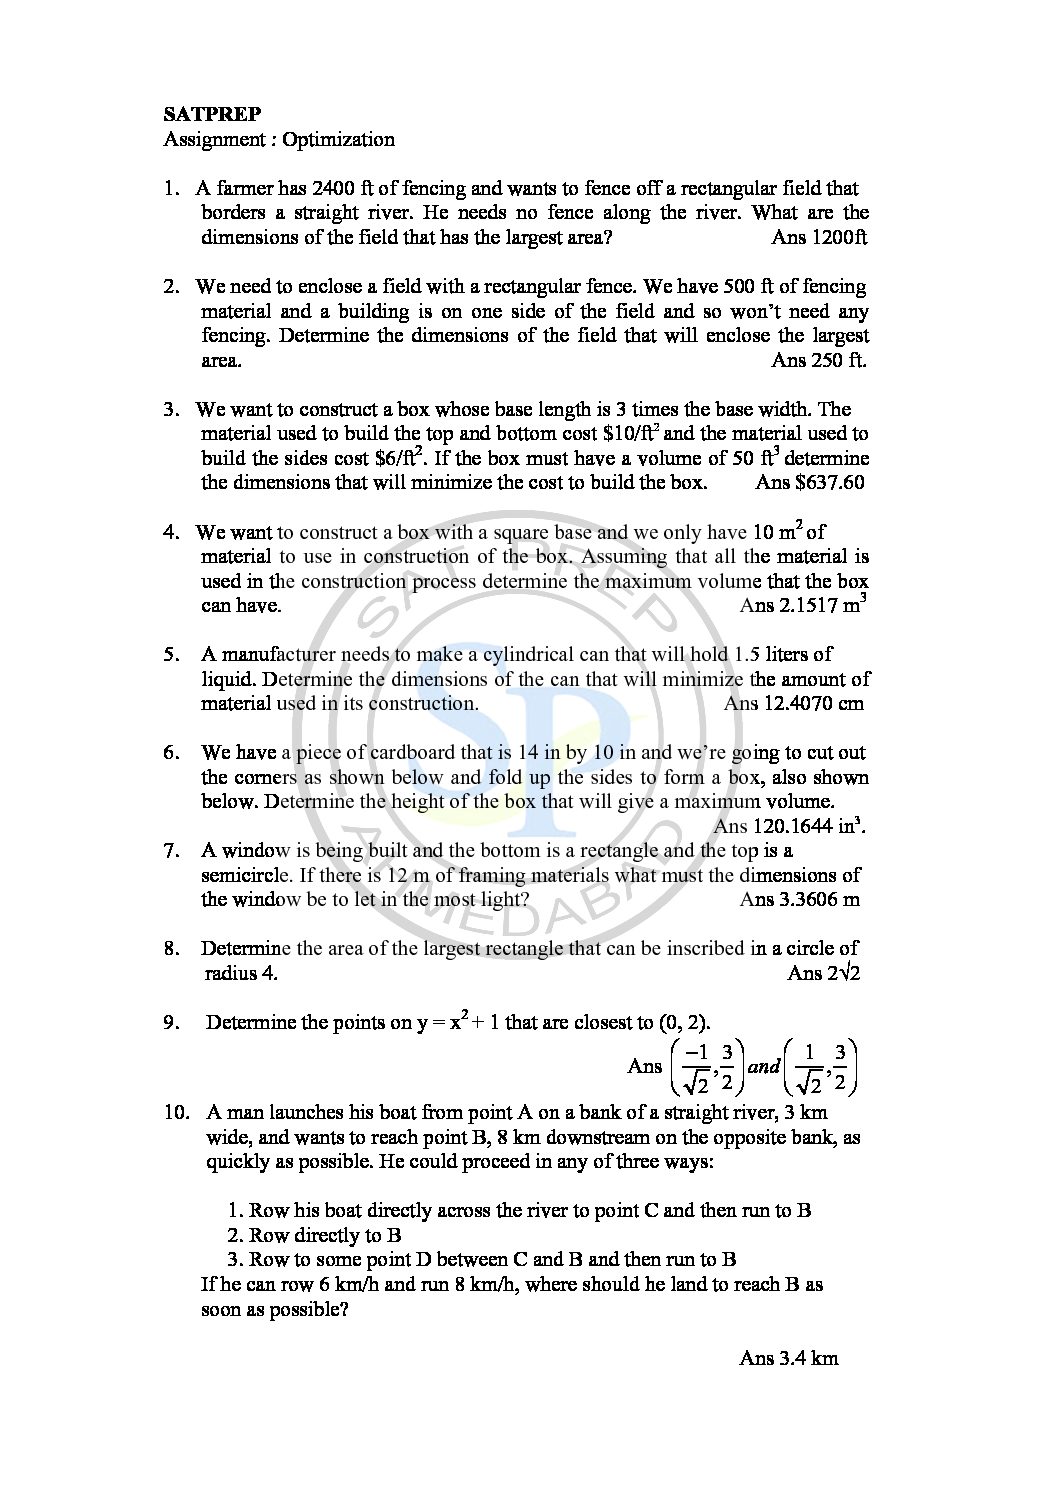
Process of optimisation means optimal value of function at turning point (maximum or minimum ) value of the curve. Therefore second derivative use to find greatest or least value . Also it show greatest value. Optimization
Domain and range
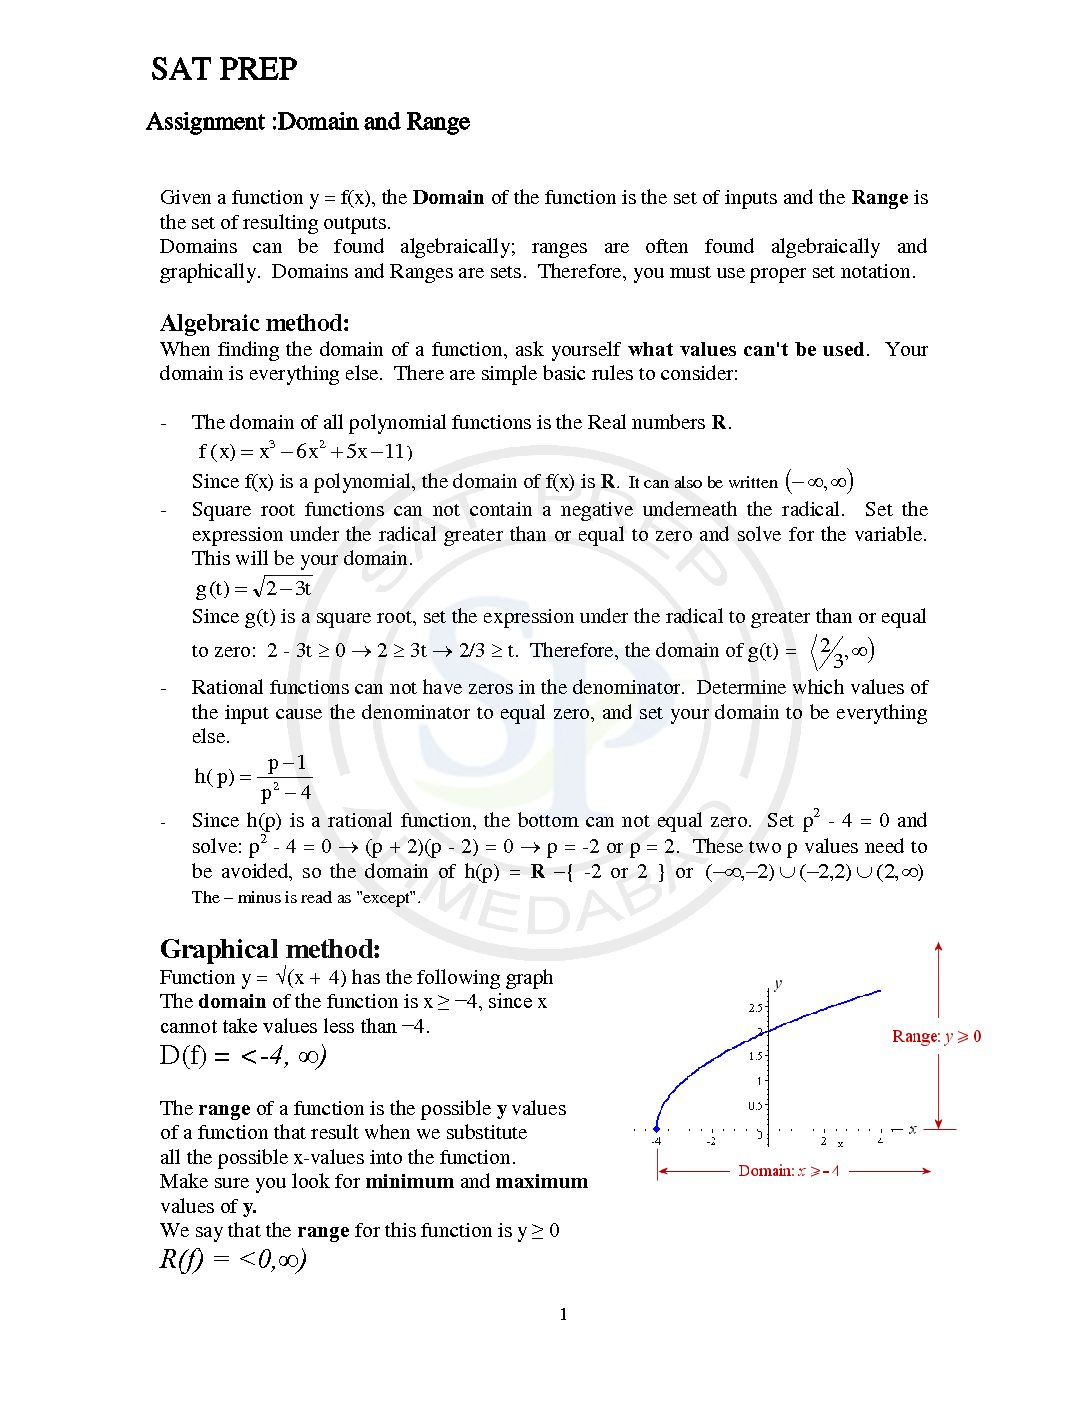
Domain represent values of x , while range represented by F(x) or y function. Mostly , functions are portrayed as a set of x/y coordinates. Therefore y-axis serving as a function of x. When we use function F(x) notation then one is independent variable and another dependent variable. Due to this on Y-axis F(x) represent. Domain and range
Graph of Trigo function
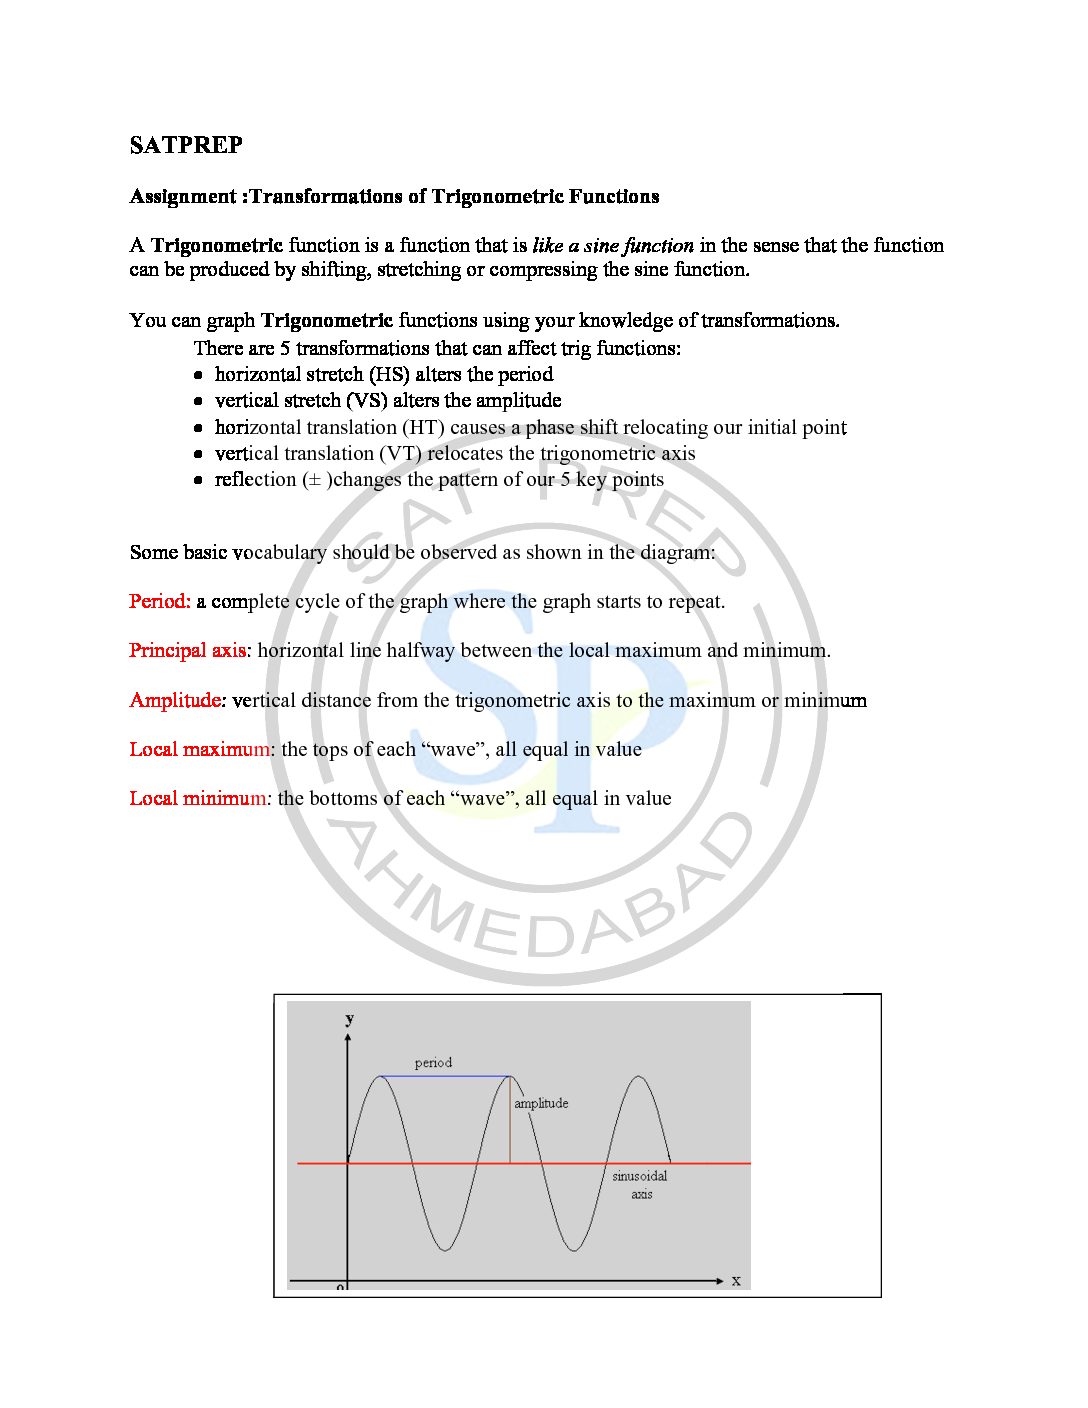
Trigo functions definition is – a function of an arc or angle most simply expressed in terms of the ratios of pairs of sides of a right-angled triangle —called also circular function. standard unit circle (a circle with radius 1 unit), starting at the origin and making some angle with the x -axis, the sine of the angle gives the […]